29
/pt/
pt
AIzaSyAYiBZKx7MnpbEhh9jyipgxe19OcubqV5w
April 1, 2024
50619
Middle income
MIC
false
2
1
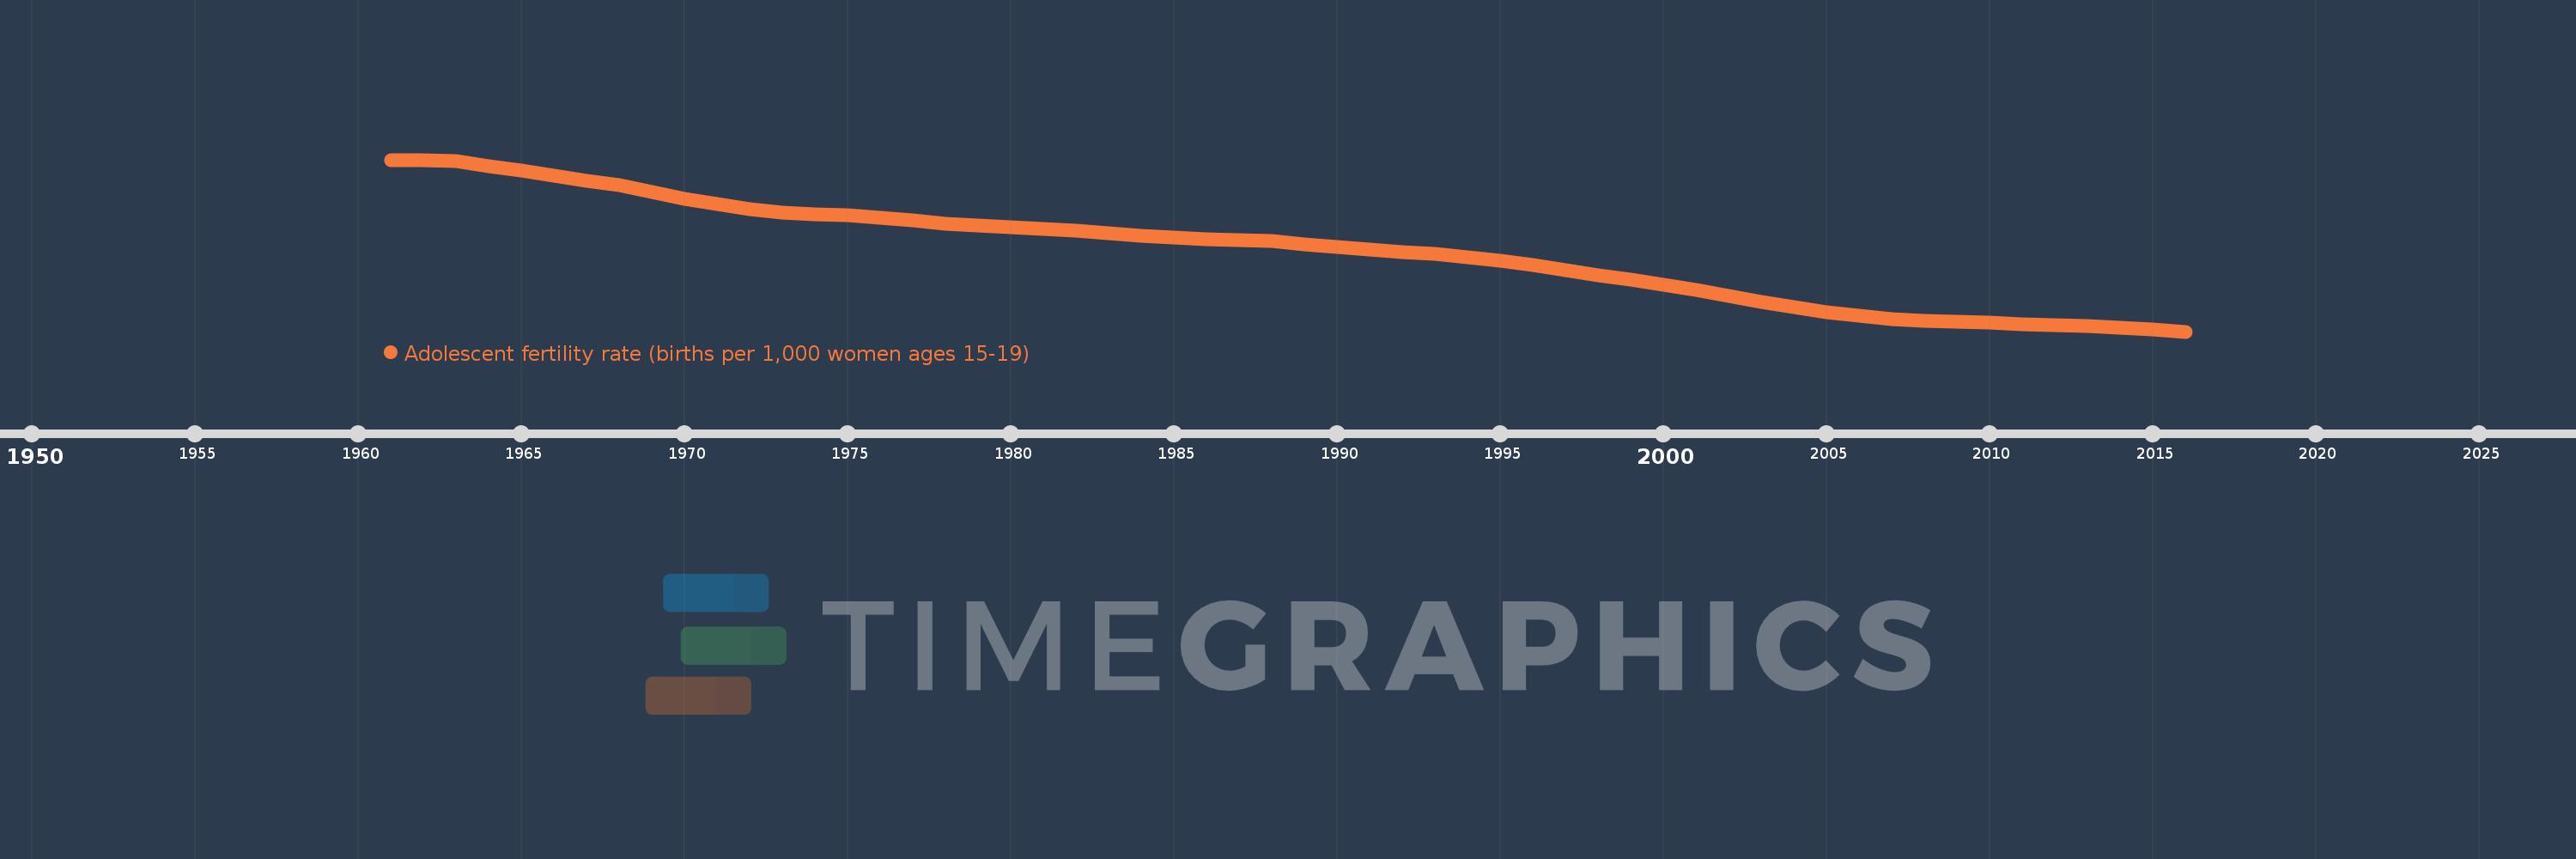
Adolescent fertility rate (births per 1,000 women ages 15-19)
2016,2015,2014,2013,2012,2011,2010,2009,2008,2007,2006,2005,2004,2003,2002,2001,2000,1999,1998,1997,1996,1995,1994,1993,1992,1991,1990,1989,1988,1987,1986,1985,1984,1983,1982,1981,1980,1979,1978,1977,1976,1975,1974,1973,1972,1971,1970,1969,1968,1967,1966,1965,1964,1963,1962,1961
Estas estatísticas em outros países:
AfghanistanAlbaniaAlgeriaAngolaAntigua and BarbudaArab WorldArgentinaArmeniaArubaAustraliaAustriaAzerbaijanBahamas, TheBahrainBangladeshBarbadosBelarusBelgiumBelizeBeninBhutanBoliviaBosnia and HerzegovinaBotswanaBrazilBrunei DarussalamBulgariaBurkina FasoBurundiCabo VerdeCambodiaCameroonCanadaCaribbean small statesCentral African RepublicCentral Europe and the BalticsChadChannel IslandsChileChinaColombiaComorosCongo, Dem. Rep.Congo, Rep.Costa RicaCote d'IvoireCroatiaCubaCuracaoCyprusCzech RepublicDenmarkDjiboutiDominican RepublicEarly-demographic dividendEast Asia & PacificEast Asia & Pacific (excluding high income)East Asia & Pacific (IDA & IBRD countries)EcuadorEgypt, Arab Rep.El SalvadorEquatorial GuineaEritreaEstoniaEthiopiaEuro areaEurope & Central AsiaEurope & Central Asia (excluding high income)Europe & Central Asia (IDA & IBRD countries)European UnionFijiFinlandFragile and conflict affected situationsFranceFrench PolynesiaGabonGambia, TheGeorgiaGermanyGhanaGreeceGrenadaGuamGuatemalaGuineaGuinea-BissauGuyanaHaitiHeavily indebted poor countries (HIPC)High incomeHondurasHong Kong SAR, ChinaHungaryIBRD onlyIcelandIDA & IBRD totalIDA blendIDA onlyIDA totalIndiaIndonesiaIran, Islamic Rep.IraqIrelandIsraelItalyJamaicaJapanJordanKazakhstanKenyaKiribatiKorea, Dem. People’s Rep.Korea, Rep.KuwaitKyrgyz RepublicLao PDRLate-demographic dividendLatin America & Caribbean Latin America & Caribbean (excluding high income)Latin America & the Caribbean (IDA & IBRD countries)LatviaLeast developed countries: UN classificationLebanonLesothoLiberiaLibyaLithuaniaLow & middle incomeLow incomeLower middle incomeLuxembourgMacao SAR, ChinaMacedonia, FYRMadagascarMalawiMalaysiaMaldivesMaliMaltaMauritaniaMauritiusMexicoMicronesia, Fed. Sts.Middle East & North AfricaMiddle East & North Africa (excluding high income)Middle East & North Africa (IDA & IBRD countries)Middle incomeMoldovaMongoliaMontenegroMoroccoMozambiqueMyanmarNamibiaNepalNetherlandsNew CaledoniaNew ZealandNicaraguaNigerNigeriaNorth AmericaNorwayOECD membersOmanOther small statesPacific island small statesPakistanPanamaPapua New GuineaParaguayPeruPhilippinesPolandPortugalPost-demographic dividendPre-demographic dividendPuerto RicoQatarRomaniaRussian FederationRwandaSamoaSao Tome and PrincipeSaudi ArabiaSenegalSerbiaSeychellesSierra LeoneSingaporeSlovak RepublicSloveniaSmall statesSolomon IslandsSomaliaSouth AfricaSouth AsiaSouth Asia (IDA & IBRD)South SudanSpainSri LankaSt. LuciaSt. Vincent and the GrenadinesSub-Saharan Africa Sub-Saharan Africa (excluding high income)Sub-Saharan Africa (IDA & IBRD countries)SudanSurinameSwazilandSwedenSwitzerlandSyrian Arab RepublicTajikistanTanzaniaThailandTimor-LesteTogoTongaTrinidad and TobagoTunisiaTurkeyTurkmenistanUgandaUkraineUnited Arab EmiratesUnited KingdomUnited StatesUpper middle incomeUruguayUzbekistanVanuatuVenezuela, RBVietnamVirgin Islands (U.S.)West Bank and GazaWorldYemen, Rep.ZambiaZimbabwe Linha do tempo:
Nesta escala de tempo está apresentado um gráfico de 1961 ano até 2016 ano Middle income. Dados de 1960 ano ausente. O número de observações reais por data: 56.
Fonte (nome):
Indicadores de desenvolvimento mundial
Fonte (organização):
United Nations Population Division, World Population Prospects.
Categorias:
Health, Gender, Social Development
Foi atualizado:
23 abr 2017 ano
Indicadores de alterações dos valores ao longo dos anos
Mínimo:
40.371
1 jan 2016 ano
Máximo:
95.048
1 jan 1961 ano
Na data de observação
Valor
Mudança absoluta
A alteração em relação ao valor anterior
1 jan 1961 ano
95.048
+95.048
0.0%
1 jan 1962 ano
95.046
-0.002
0.0%
1 jan 1963 ano
94.566
-0.479
-0.5%
1 jan 1964 ano
93.072
-1.494
-1.58%
1 jan 1965 ano
91.511
-1.561
-1.68%
1 jan 1966 ano
89.979
-1.533
-1.67%
1 jan 1967 ano
88.452
-1.526
-1.7%
1 jan 1968 ano
86.937
-1.516
-1.71%
1 jan 1969 ano
84.708
-2.228
-2.56%
1 jan 1970 ano
82.676
-2.033
-2.4%
1 jan 1971 ano
80.929
-1.746
-2.11%
1 jan 1972 ano
79.352
-1.577
-1.95%
1 jan 1973 ano
78.165
-1.187
-1.5%
1 jan 1974 ano
77.732
-0.433
-0.55%
1 jan 1975 ano
77.289
-0.443
-0.57%
1 jan 1976 ano
76.64
-0.648
-0.84%
1 jan 1977 ano
75.745
-0.895
-1.17%
1 jan 1978 ano
74.626
-1.119
-1.48%
1 jan 1979 ano
74.169
-0.457
-0.61%
1 jan 1980 ano
73.618
-0.551
-0.74%
1 jan 1981 ano
73.063
-0.555
-0.75%
1 jan 1982 ano
72.388
-0.675
-0.92%
1 jan 1983 ano
71.697
-0.691
-0.95%
1 jan 1984 ano
70.859
-0.838
-1.17%
1 jan 1985 ano
70.206
-0.653
-0.92%
1 jan 1986 ano
69.746
-0.46
-0.65%
1 jan 1987 ano
69.419
-0.328
-0.47%
1 jan 1988 ano
69.231
-0.188
-0.27%
1 jan 1989 ano
68.186
-1.045
-1.51%
1 jan 1990 ano
67.269
-0.917
-1.34%
1 jan 1991 ano
66.469
-0.801
-1.19%
1 jan 1992 ano
65.758
-0.711
-1.07%
1 jan 1993 ano
65.117
-0.641
-0.97%
1 jan 1994 ano
64.087
-1.029
-1.58%
1 jan 1995 ano
62.941
-1.147
-1.79%
1 jan 1996 ano
61.593
-1.348
-2.14%
1 jan 1997 ano
59.965
-1.628
-2.64%
1 jan 1998 ano
58.174
-1.79
-2.99%
1 jan 1999 ano
56.854
-1.32
-2.27%
1 jan 2000 ano
55.334
-1.52
-2.67%
1 jan 2001 ano
53.636
-1.698
-3.07%
1 jan 2002 ano
51.779
-1.857
-3.46%
1 jan 2003 ano
49.789
-1.99
-3.84%
1 jan 2004 ano
48.096
-1.692
-3.4%
1 jan 2005 ano
46.613
-1.484
-3.09%
1 jan 2006 ano
45.415
-1.198
-2.57%
1 jan 2007 ano
44.452
-0.963
-2.12%
1 jan 2008 ano
43.715
-0.737
-1.66%
1 jan 2009 ano
43.388
-0.327
-0.75%
1 jan 2010 ano
43.117
-0.271
-0.62%
1 jan 2011 ano
42.819
-0.298
-0.69%
1 jan 2012 ano
42.492
-0.327
-0.76%
1 jan 2013 ano
42.144
-0.348
-0.82%
1 jan 2014 ano
41.653
-0.492
-1.17%
1 jan 2015 ano
41.068
-0.584
-1.4%
1 jan 2016 ano
40.371
-0.698
-1.7%
Classificação de países por estatísticas atuais por anos


Comentários: