29
/pt/
pt
AIzaSyAYiBZKx7MnpbEhh9jyipgxe19OcubqV5w
April 1, 2024
63194
Afghanistan
AFG
true
2
1
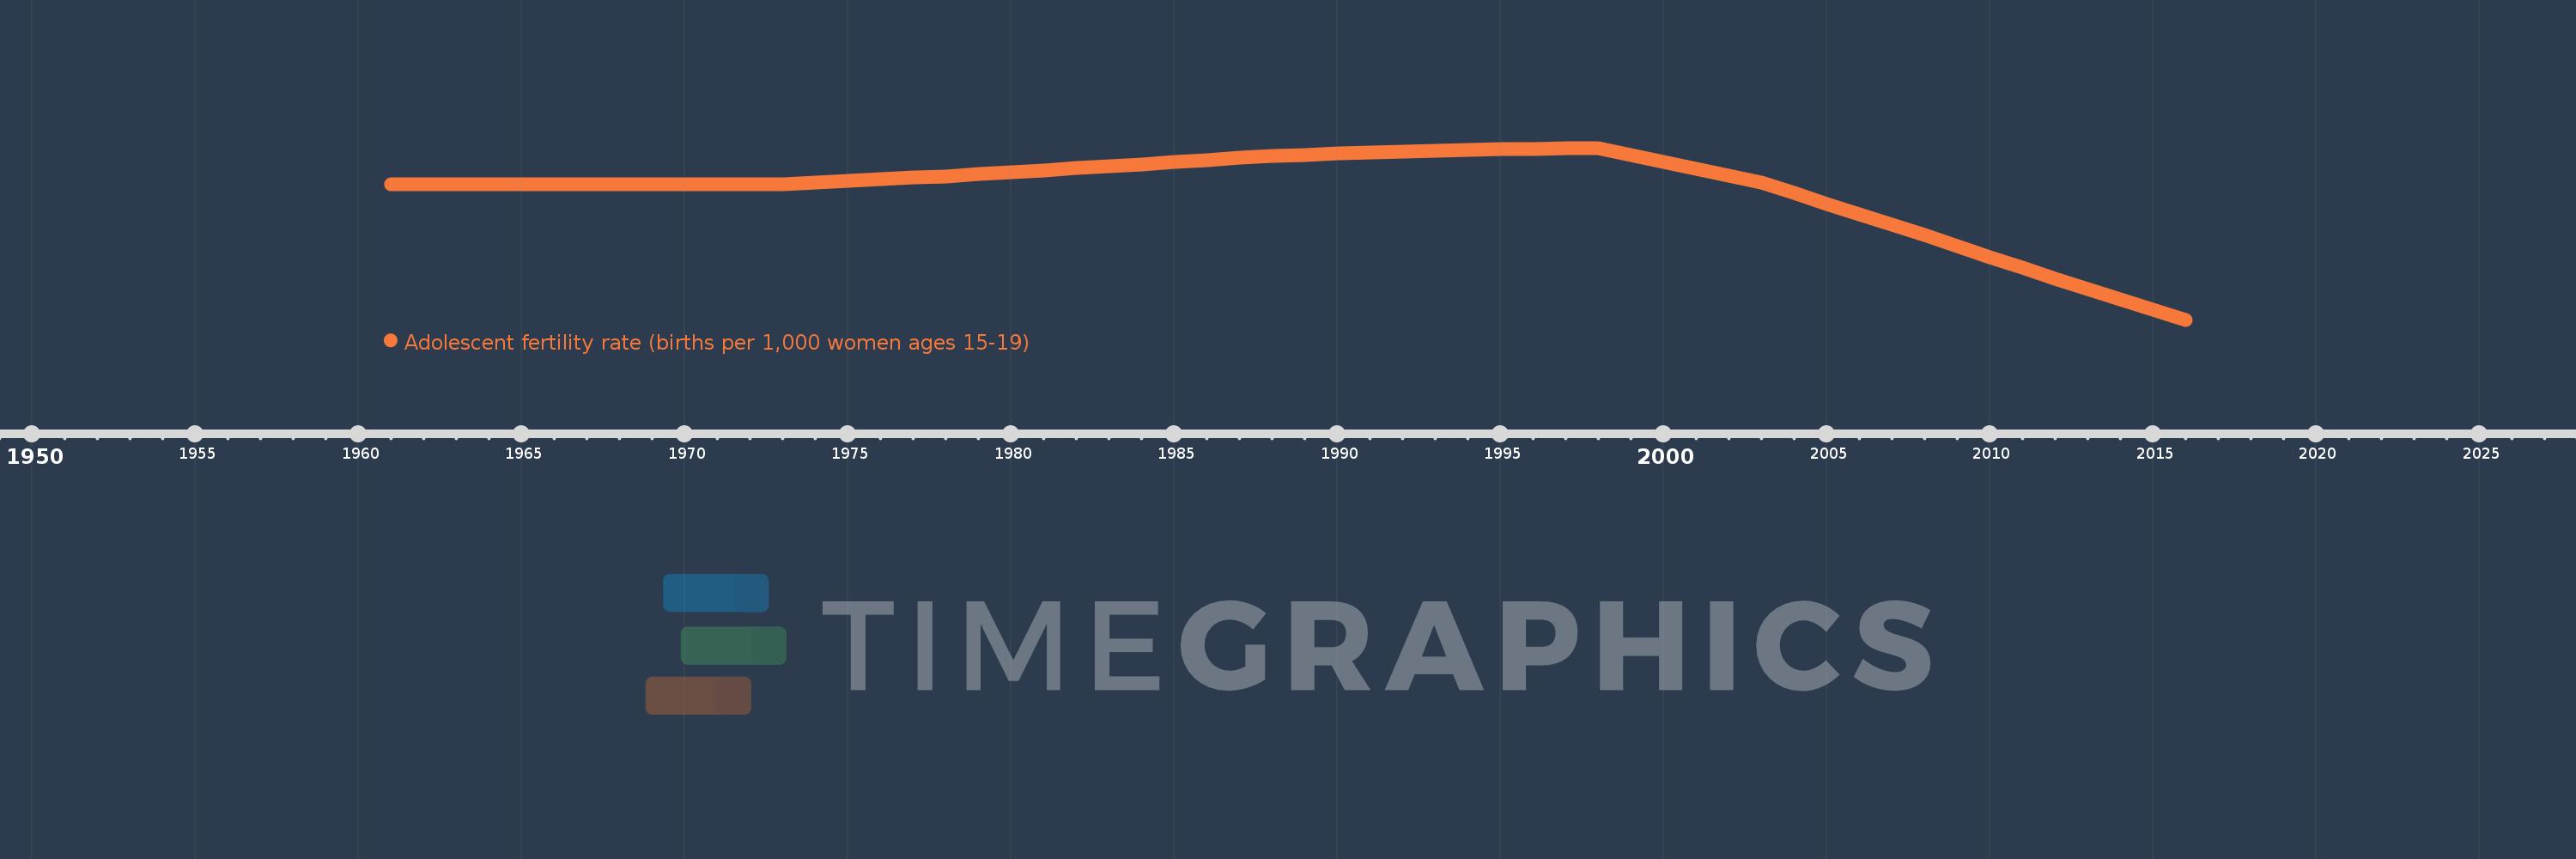
Adolescent fertility rate (births per 1,000 women ages 15-19)
2016,2015,2014,2013,2012,2011,2010,2009,2008,2007,2006,2005,2004,2003,2002,2001,2000,1999,1998,1997,1996,1995,1994,1993,1992,1991,1990,1989,1988,1987,1986,1985,1984,1983,1982,1981,1980,1979,1978,1977,1976,1975,1974,1973,1972,1971,1970,1969,1968,1967,1966,1965,1964,1963,1962,1961
Estas estatísticas em outros países:
AfghanistanAlbaniaAlgeriaAngolaAntigua and BarbudaArab WorldArgentinaArmeniaArubaAustraliaAustriaAzerbaijanBahamas, TheBahrainBangladeshBarbadosBelarusBelgiumBelizeBeninBhutanBoliviaBosnia and HerzegovinaBotswanaBrazilBrunei DarussalamBulgariaBurkina FasoBurundiCabo VerdeCambodiaCameroonCanadaCaribbean small statesCentral African RepublicCentral Europe and the BalticsChadChannel IslandsChileChinaColombiaComorosCongo, Dem. Rep.Congo, Rep.Costa RicaCote d'IvoireCroatiaCubaCuracaoCyprusCzech RepublicDenmarkDjiboutiDominican RepublicEarly-demographic dividendEast Asia & PacificEast Asia & Pacific (excluding high income)East Asia & Pacific (IDA & IBRD countries)EcuadorEgypt, Arab Rep.El SalvadorEquatorial GuineaEritreaEstoniaEthiopiaEuro areaEurope & Central AsiaEurope & Central Asia (excluding high income)Europe & Central Asia (IDA & IBRD countries)European UnionFijiFinlandFragile and conflict affected situationsFranceFrench PolynesiaGabonGambia, TheGeorgiaGermanyGhanaGreeceGrenadaGuamGuatemalaGuineaGuinea-BissauGuyanaHaitiHeavily indebted poor countries (HIPC)High incomeHondurasHong Kong SAR, ChinaHungaryIBRD onlyIcelandIDA & IBRD totalIDA blendIDA onlyIDA totalIndiaIndonesiaIran, Islamic Rep.IraqIrelandIsraelItalyJamaicaJapanJordanKazakhstanKenyaKiribatiKorea, Dem. People’s Rep.Korea, Rep.KuwaitKyrgyz RepublicLao PDRLate-demographic dividendLatin America & Caribbean Latin America & Caribbean (excluding high income)Latin America & the Caribbean (IDA & IBRD countries)LatviaLeast developed countries: UN classificationLebanonLesothoLiberiaLibyaLithuaniaLow & middle incomeLow incomeLower middle incomeLuxembourgMacao SAR, ChinaMacedonia, FYRMadagascarMalawiMalaysiaMaldivesMaliMaltaMauritaniaMauritiusMexicoMicronesia, Fed. Sts.Middle East & North AfricaMiddle East & North Africa (excluding high income)Middle East & North Africa (IDA & IBRD countries)Middle incomeMoldovaMongoliaMontenegroMoroccoMozambiqueMyanmarNamibiaNepalNetherlandsNew CaledoniaNew ZealandNicaraguaNigerNigeriaNorth AmericaNorwayOECD membersOmanOther small statesPacific island small statesPakistanPanamaPapua New GuineaParaguayPeruPhilippinesPolandPortugalPost-demographic dividendPre-demographic dividendPuerto RicoQatarRomaniaRussian FederationRwandaSamoaSao Tome and PrincipeSaudi ArabiaSenegalSerbiaSeychellesSierra LeoneSingaporeSlovak RepublicSloveniaSmall statesSolomon IslandsSomaliaSouth AfricaSouth AsiaSouth Asia (IDA & IBRD)South SudanSpainSri LankaSt. LuciaSt. Vincent and the GrenadinesSub-Saharan Africa Sub-Saharan Africa (excluding high income)Sub-Saharan Africa (IDA & IBRD countries)SudanSurinameSwazilandSwedenSwitzerlandSyrian Arab RepublicTajikistanTanzaniaThailandTimor-LesteTogoTongaTrinidad and TobagoTunisiaTurkeyTurkmenistanUgandaUkraineUnited Arab EmiratesUnited KingdomUnited StatesUpper middle incomeUruguayUzbekistanVanuatuVenezuela, RBVietnamVirgin Islands (U.S.)West Bank and GazaWorldYemen, Rep.ZambiaZimbabwe Linha do tempo:
Nesta escala de tempo está apresentado um gráfico de 1961 ano até 2016 ano Afghanistan. Dados de 1960 ano ausente. O número de observações reais por data: 56.
Fonte (nome):
Indicadores de desenvolvimento mundial
Fonte (organização):
United Nations Population Division, World Population Prospects.
Categorias:
Health, Gender, Social Development
Foi atualizado:
23 abr 2017 ano
Indicadores de alterações dos valores ao longo dos anos
Mínimo:
71.203
1 jan 2016 ano
Máximo:
165.242
1 jan 1998 ano
Na data de observação
Valor
Mudança absoluta
A alteração em relação ao valor anterior
1 jan 1961 ano
145.321
+145.321
0.0%
1 jan 1962 ano
145.321
0.0
0.0%
1 jan 1963 ano
145.321
0.0
0.0%
1 jan 1964 ano
145.321
0.0
0.0%
1 jan 1965 ano
145.321
0.0
0.0%
1 jan 1966 ano
145.321
0.0
0.0%
1 jan 1967 ano
145.321
0.0
0.0%
1 jan 1968 ano
145.321
0.0
0.0%
1 jan 1969 ano
145.321
0.0
0.0%
1 jan 1970 ano
145.321
0.0
0.0%
1 jan 1971 ano
145.321
0.0
0.0%
1 jan 1972 ano
145.321
0.0
0.0%
1 jan 1973 ano
145.321
0.0
0.0%
1 jan 1974 ano
146.215
+0.894
0.62%
1 jan 1975 ano
147.109
+0.894
0.61%
1 jan 1976 ano
148.003
+0.894
0.61%
1 jan 1977 ano
148.897
+0.894
0.6%
1 jan 1978 ano
149.791
+0.894
0.6%
1 jan 1979 ano
150.878
+1.087
0.73%
1 jan 1980 ano
151.965
+1.087
0.72%
1 jan 1981 ano
153.053
+1.087
0.72%
1 jan 1982 ano
154.14
+1.087
0.71%
1 jan 1983 ano
155.227
+1.087
0.71%
1 jan 1984 ano
156.376
+1.149
0.74%
1 jan 1985 ano
157.525
+1.149
0.73%
1 jan 1986 ano
158.673
+1.149
0.73%
1 jan 1987 ano
159.822
+1.149
0.72%
1 jan 1988 ano
160.971
+1.149
0.72%
1 jan 1989 ano
161.56
+0.589
0.37%
1 jan 1990 ano
162.149
+0.589
0.36%
1 jan 1991 ano
162.738
+0.589
0.36%
1 jan 1992 ano
163.327
+0.589
0.36%
1 jan 1993 ano
163.916
+0.589
0.36%
1 jan 1994 ano
164.181
+0.265
0.16%
1 jan 1995 ano
164.446
+0.265
0.16%
1 jan 1996 ano
164.712
+0.265
0.16%
1 jan 1997 ano
164.977
+0.265
0.16%
1 jan 1998 ano
165.242
+0.265
0.16%
1 jan 1999 ano
161.443
-3.799
-2.3%
1 jan 2000 ano
157.644
-3.799
-2.35%
1 jan 2001 ano
153.846
-3.799
-2.41%
1 jan 2002 ano
150.047
-3.799
-2.47%
1 jan 2003 ano
146.248
-3.799
-2.53%
1 jan 2004 ano
140.476
-5.772
-3.95%
1 jan 2005 ano
134.705
-5.772
-4.11%
1 jan 2006 ano
128.933
-5.772
-4.28%
1 jan 2007 ano
123.162
-5.772
-4.48%
1 jan 2008 ano
117.39
-5.772
-4.69%
1 jan 2009 ano
111.471
-5.919
-5.04%
1 jan 2010 ano
105.552
-5.919
-5.31%
1 jan 2011 ano
99.632
-5.919
-5.61%
1 jan 2012 ano
93.713
-5.919
-5.94%
1 jan 2013 ano
87.794
-5.919
-6.32%
1 jan 2014 ano
82.264
-5.53
-6.3%
1 jan 2015 ano
76.734
-5.53
-6.72%
1 jan 2016 ano
71.203
-5.53
-7.21%
Classificação de países por estatísticas atuais por anos


Comentários: