29
/pt/
pt
AIzaSyAYiBZKx7MnpbEhh9jyipgxe19OcubqV5w
April 1, 2024
104389
Channel Islands
CHI
true
2
1
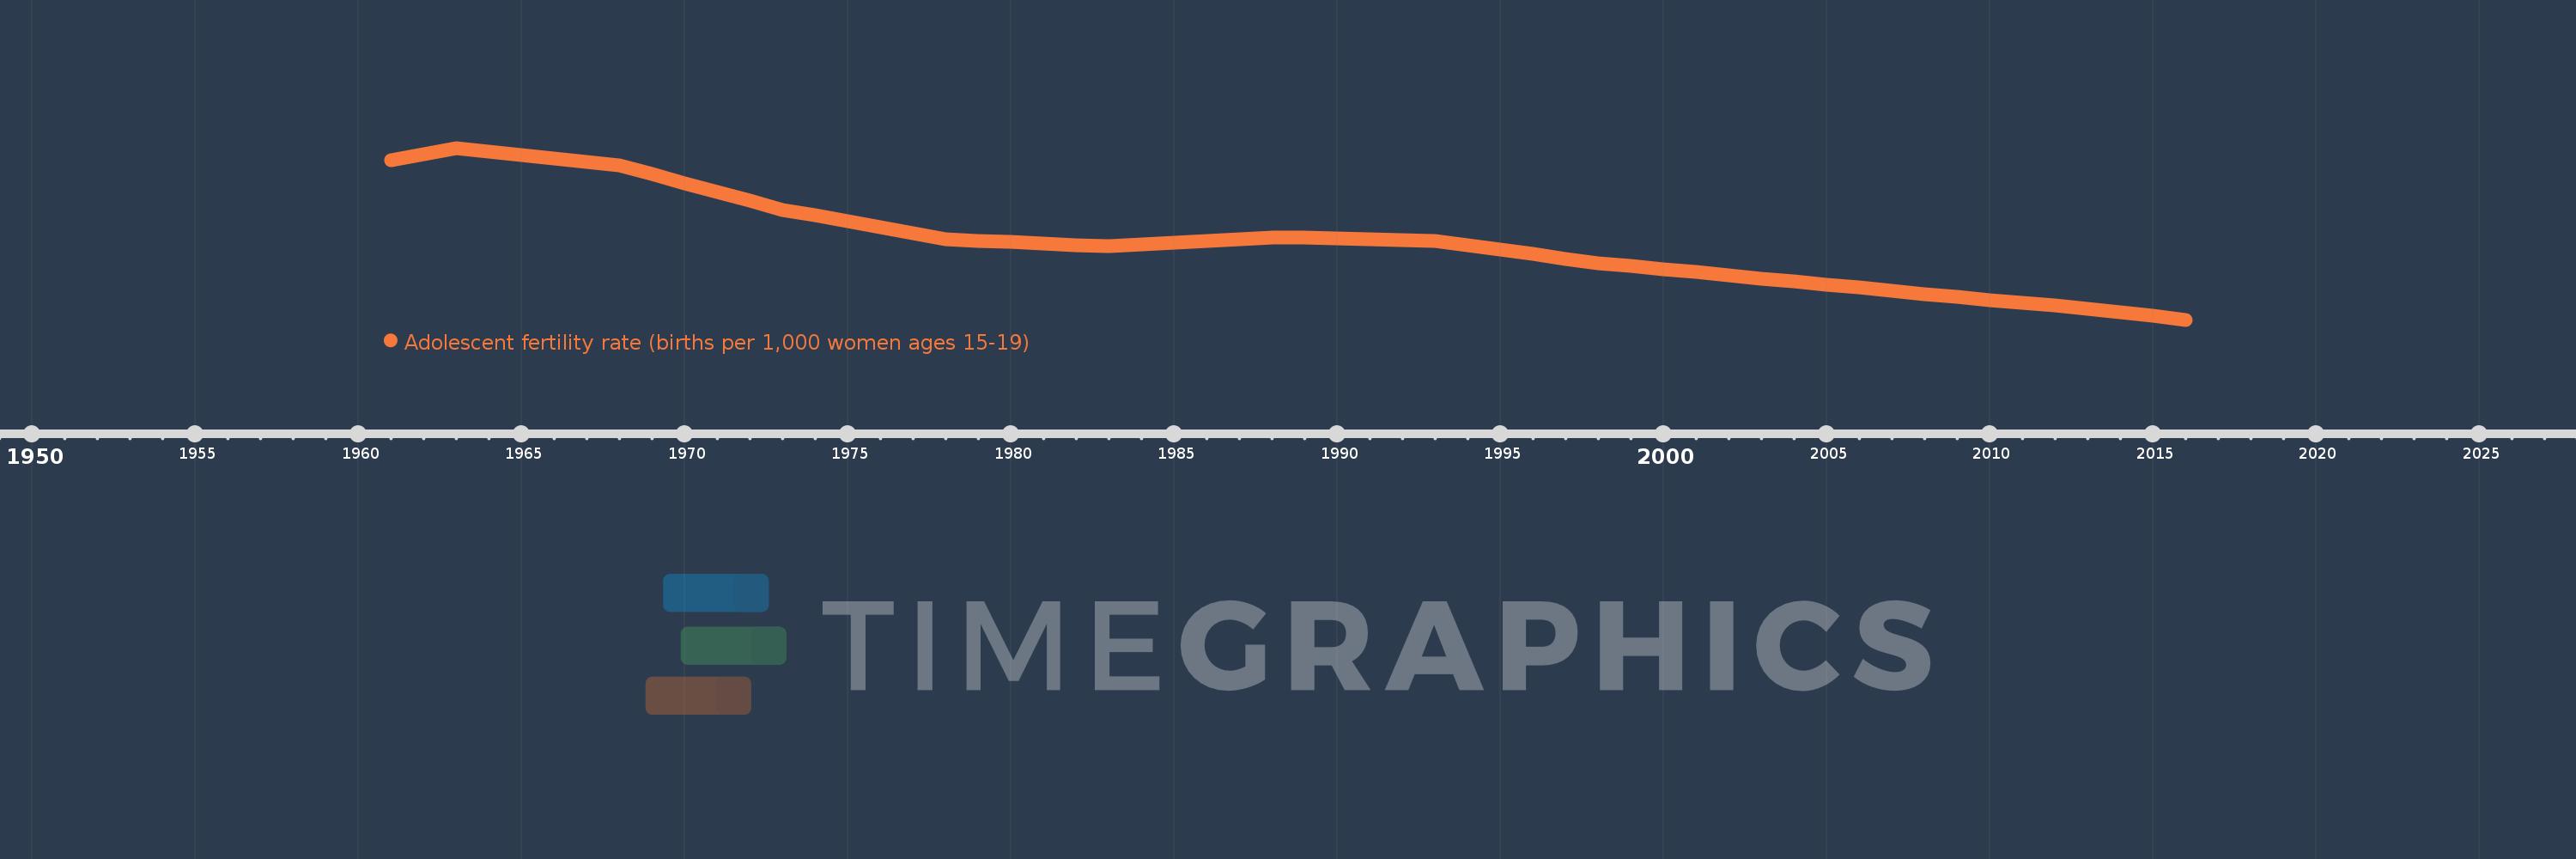
Adolescent fertility rate (births per 1,000 women ages 15-19)
2016,2015,2014,2013,2012,2011,2010,2009,2008,2007,2006,2005,2004,2003,2002,2001,2000,1999,1998,1997,1996,1995,1994,1993,1992,1991,1990,1989,1988,1987,1986,1985,1984,1983,1982,1981,1980,1979,1978,1977,1976,1975,1974,1973,1972,1971,1970,1969,1968,1967,1966,1965,1964,1963,1962,1961
Estas estatísticas em outros países:
AfghanistanAlbaniaAlgeriaAngolaAntigua and BarbudaArab WorldArgentinaArmeniaArubaAustraliaAustriaAzerbaijanBahamas, TheBahrainBangladeshBarbadosBelarusBelgiumBelizeBeninBhutanBoliviaBosnia and HerzegovinaBotswanaBrazilBrunei DarussalamBulgariaBurkina FasoBurundiCabo VerdeCambodiaCameroonCanadaCaribbean small statesCentral African RepublicCentral Europe and the BalticsChadChannel IslandsChileChinaColombiaComorosCongo, Dem. Rep.Congo, Rep.Costa RicaCote d'IvoireCroatiaCubaCuracaoCyprusCzech RepublicDenmarkDjiboutiDominican RepublicEarly-demographic dividendEast Asia & PacificEast Asia & Pacific (excluding high income)East Asia & Pacific (IDA & IBRD countries)EcuadorEgypt, Arab Rep.El SalvadorEquatorial GuineaEritreaEstoniaEthiopiaEuro areaEurope & Central AsiaEurope & Central Asia (excluding high income)Europe & Central Asia (IDA & IBRD countries)European UnionFijiFinlandFragile and conflict affected situationsFranceFrench PolynesiaGabonGambia, TheGeorgiaGermanyGhanaGreeceGrenadaGuamGuatemalaGuineaGuinea-BissauGuyanaHaitiHeavily indebted poor countries (HIPC)High incomeHondurasHong Kong SAR, ChinaHungaryIBRD onlyIcelandIDA & IBRD totalIDA blendIDA onlyIDA totalIndiaIndonesiaIran, Islamic Rep.IraqIrelandIsraelItalyJamaicaJapanJordanKazakhstanKenyaKiribatiKorea, Dem. People’s Rep.Korea, Rep.KuwaitKyrgyz RepublicLao PDRLate-demographic dividendLatin America & Caribbean Latin America & Caribbean (excluding high income)Latin America & the Caribbean (IDA & IBRD countries)LatviaLeast developed countries: UN classificationLebanonLesothoLiberiaLibyaLithuaniaLow & middle incomeLow incomeLower middle incomeLuxembourgMacao SAR, ChinaMacedonia, FYRMadagascarMalawiMalaysiaMaldivesMaliMaltaMauritaniaMauritiusMexicoMicronesia, Fed. Sts.Middle East & North AfricaMiddle East & North Africa (excluding high income)Middle East & North Africa (IDA & IBRD countries)Middle incomeMoldovaMongoliaMontenegroMoroccoMozambiqueMyanmarNamibiaNepalNetherlandsNew CaledoniaNew ZealandNicaraguaNigerNigeriaNorth AmericaNorwayOECD membersOmanOther small statesPacific island small statesPakistanPanamaPapua New GuineaParaguayPeruPhilippinesPolandPortugalPost-demographic dividendPre-demographic dividendPuerto RicoQatarRomaniaRussian FederationRwandaSamoaSao Tome and PrincipeSaudi ArabiaSenegalSerbiaSeychellesSierra LeoneSingaporeSlovak RepublicSloveniaSmall statesSolomon IslandsSomaliaSouth AfricaSouth AsiaSouth Asia (IDA & IBRD)South SudanSpainSri LankaSt. LuciaSt. Vincent and the GrenadinesSub-Saharan Africa Sub-Saharan Africa (excluding high income)Sub-Saharan Africa (IDA & IBRD countries)SudanSurinameSwazilandSwedenSwitzerlandSyrian Arab RepublicTajikistanTanzaniaThailandTimor-LesteTogoTongaTrinidad and TobagoTunisiaTurkeyTurkmenistanUgandaUkraineUnited Arab EmiratesUnited KingdomUnited StatesUpper middle incomeUruguayUzbekistanVanuatuVenezuela, RBVietnamVirgin Islands (U.S.)West Bank and GazaWorldYemen, Rep.ZambiaZimbabwe Linha do tempo:
Nesta escala de tempo está apresentado um gráfico de 1961 ano até 2016 ano Channel Islands. Dados de 1960 ano ausente. O número de observações reais por data: 56.
Fonte (nome):
Indicadores de desenvolvimento mundial
Fonte (organização):
United Nations Population Division, World Population Prospects.
Categorias:
Health, Gender, Social Development
Foi atualizado:
23 abr 2017 ano
Indicadores de alterações dos valores ao longo dos anos
Mínimo:
6.677
1 jan 2016 ano
Máximo:
28.269
1 jan 1963 ano
Na data de observação
Valor
Mudança absoluta
A alteração em relação ao valor anterior
1 jan 1961 ano
26.769
+26.769
0.0%
1 jan 1962 ano
27.519
+0.75
2.8%
1 jan 1963 ano
28.269
+0.75
2.73%
1 jan 1964 ano
27.828
-0.441
-1.56%
1 jan 1965 ano
27.386
-0.441
-1.59%
1 jan 1966 ano
26.945
-0.441
-1.61%
1 jan 1967 ano
26.503
-0.441
-1.64%
1 jan 1968 ano
26.062
-0.441
-1.67%
1 jan 1969 ano
24.95
-1.112
-4.27%
1 jan 1970 ano
23.838
-1.112
-4.46%
1 jan 1971 ano
22.725
-1.112
-4.67%
1 jan 1972 ano
21.613
-1.112
-4.89%
1 jan 1973 ano
20.501
-1.112
-5.15%
1 jan 1974 ano
19.762
-0.739
-3.61%
1 jan 1975 ano
19.023
-0.739
-3.74%
1 jan 1976 ano
18.283
-0.739
-3.89%
1 jan 1977 ano
17.544
-0.739
-4.04%
1 jan 1978 ano
16.805
-0.739
-4.21%
1 jan 1979 ano
16.62
-0.185
-1.1%
1 jan 1980 ano
16.434
-0.185
-1.12%
1 jan 1981 ano
16.249
-0.185
-1.13%
1 jan 1982 ano
16.063
-0.185
-1.14%
1 jan 1983 ano
15.878
-0.185
-1.15%
1 jan 1984 ano
16.114
+0.236
1.49%
1 jan 1985 ano
16.35
+0.236
1.46%
1 jan 1986 ano
16.586
+0.236
1.44%
1 jan 1987 ano
16.822
+0.236
1.42%
1 jan 1988 ano
17.058
+0.236
1.4%
1 jan 1989 ano
16.969
-0.089
-0.52%
1 jan 1990 ano
16.88
-0.089
-0.52%
1 jan 1991 ano
16.792
-0.089
-0.53%
1 jan 1992 ano
16.703
-0.089
-0.53%
1 jan 1993 ano
16.614
-0.089
-0.53%
1 jan 1994 ano
16.046
-0.568
-3.42%
1 jan 1995 ano
15.479
-0.568
-3.54%
1 jan 1996 ano
14.911
-0.568
-3.67%
1 jan 1997 ano
14.344
-0.568
-3.81%
1 jan 1998 ano
13.776
-0.568
-3.96%
1 jan 1999 ano
13.396
-0.38
-2.76%
1 jan 2000 ano
13.017
-0.38
-2.83%
1 jan 2001 ano
12.637
-0.38
-2.92%
1 jan 2002 ano
12.258
-0.38
-3.0%
1 jan 2003 ano
11.878
-0.38
-3.1%
1 jan 2004 ano
11.485
-0.393
-3.31%
1 jan 2005 ano
11.092
-0.393
-3.42%
1 jan 2006 ano
10.698
-0.393
-3.55%
1 jan 2007 ano
10.305
-0.393
-3.68%
1 jan 2008 ano
9.912
-0.393
-3.82%
1 jan 2009 ano
9.543
-0.369
-3.72%
1 jan 2010 ano
9.174
-0.369
-3.86%
1 jan 2011 ano
8.806
-0.369
-4.02%
1 jan 2012 ano
8.437
-0.369
-4.19%
1 jan 2013 ano
8.068
-0.369
-4.37%
1 jan 2014 ano
7.604
-0.464
-5.75%
1 jan 2015 ano
7.141
-0.464
-6.1%
1 jan 2016 ano
6.677
-0.464
-6.49%
Classificação de países por estatísticas atuais por anos


Comentários: