29
/pt/
pt
AIzaSyAYiBZKx7MnpbEhh9jyipgxe19OcubqV5w
April 1, 2024
211314
Niger
NER
true
2
1
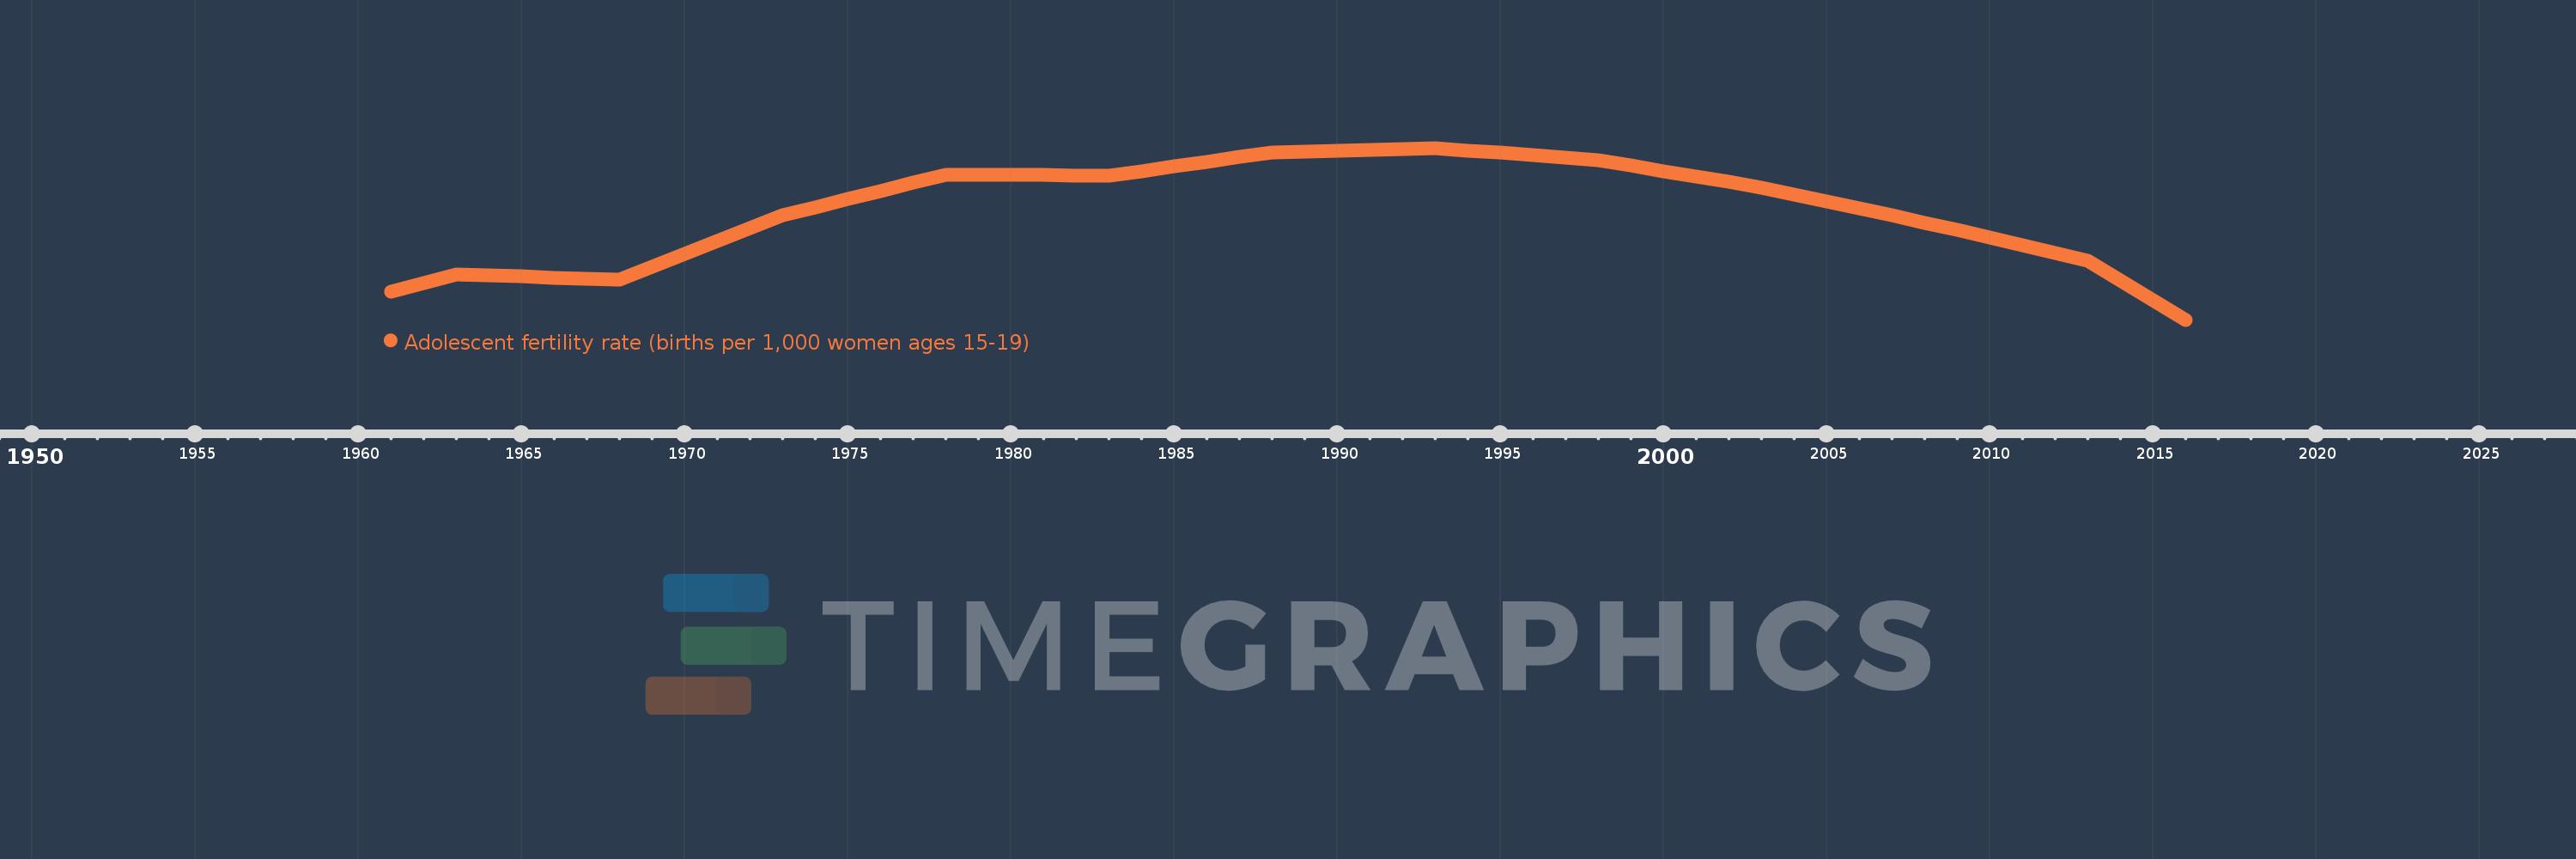
Adolescent fertility rate (births per 1,000 women ages 15-19)
2016,2015,2014,2013,2012,2011,2010,2009,2008,2007,2006,2005,2004,2003,2002,2001,2000,1999,1998,1997,1996,1995,1994,1993,1992,1991,1990,1989,1988,1987,1986,1985,1984,1983,1982,1981,1980,1979,1978,1977,1976,1975,1974,1973,1972,1971,1970,1969,1968,1967,1966,1965,1964,1963,1962,1961
Estas estatísticas em outros países:
AfghanistanAlbaniaAlgeriaAngolaAntigua and BarbudaArab WorldArgentinaArmeniaArubaAustraliaAustriaAzerbaijanBahamas, TheBahrainBangladeshBarbadosBelarusBelgiumBelizeBeninBhutanBoliviaBosnia and HerzegovinaBotswanaBrazilBrunei DarussalamBulgariaBurkina FasoBurundiCabo VerdeCambodiaCameroonCanadaCaribbean small statesCentral African RepublicCentral Europe and the BalticsChadChannel IslandsChileChinaColombiaComorosCongo, Dem. Rep.Congo, Rep.Costa RicaCote d'IvoireCroatiaCubaCuracaoCyprusCzech RepublicDenmarkDjiboutiDominican RepublicEarly-demographic dividendEast Asia & PacificEast Asia & Pacific (excluding high income)East Asia & Pacific (IDA & IBRD countries)EcuadorEgypt, Arab Rep.El SalvadorEquatorial GuineaEritreaEstoniaEthiopiaEuro areaEurope & Central AsiaEurope & Central Asia (excluding high income)Europe & Central Asia (IDA & IBRD countries)European UnionFijiFinlandFragile and conflict affected situationsFranceFrench PolynesiaGabonGambia, TheGeorgiaGermanyGhanaGreeceGrenadaGuamGuatemalaGuineaGuinea-BissauGuyanaHaitiHeavily indebted poor countries (HIPC)High incomeHondurasHong Kong SAR, ChinaHungaryIBRD onlyIcelandIDA & IBRD totalIDA blendIDA onlyIDA totalIndiaIndonesiaIran, Islamic Rep.IraqIrelandIsraelItalyJamaicaJapanJordanKazakhstanKenyaKiribatiKorea, Dem. People’s Rep.Korea, Rep.KuwaitKyrgyz RepublicLao PDRLate-demographic dividendLatin America & Caribbean Latin America & Caribbean (excluding high income)Latin America & the Caribbean (IDA & IBRD countries)LatviaLeast developed countries: UN classificationLebanonLesothoLiberiaLibyaLithuaniaLow & middle incomeLow incomeLower middle incomeLuxembourgMacao SAR, ChinaMacedonia, FYRMadagascarMalawiMalaysiaMaldivesMaliMaltaMauritaniaMauritiusMexicoMicronesia, Fed. Sts.Middle East & North AfricaMiddle East & North Africa (excluding high income)Middle East & North Africa (IDA & IBRD countries)Middle incomeMoldovaMongoliaMontenegroMoroccoMozambiqueMyanmarNamibiaNepalNetherlandsNew CaledoniaNew ZealandNicaraguaNigerNigeriaNorth AmericaNorwayOECD membersOmanOther small statesPacific island small statesPakistanPanamaPapua New GuineaParaguayPeruPhilippinesPolandPortugalPost-demographic dividendPre-demographic dividendPuerto RicoQatarRomaniaRussian FederationRwandaSamoaSao Tome and PrincipeSaudi ArabiaSenegalSerbiaSeychellesSierra LeoneSingaporeSlovak RepublicSloveniaSmall statesSolomon IslandsSomaliaSouth AfricaSouth AsiaSouth Asia (IDA & IBRD)South SudanSpainSri LankaSt. LuciaSt. Vincent and the GrenadinesSub-Saharan Africa Sub-Saharan Africa (excluding high income)Sub-Saharan Africa (IDA & IBRD countries)SudanSurinameSwazilandSwedenSwitzerlandSyrian Arab RepublicTajikistanTanzaniaThailandTimor-LesteTogoTongaTrinidad and TobagoTunisiaTurkeyTurkmenistanUgandaUkraineUnited Arab EmiratesUnited KingdomUnited StatesUpper middle incomeUruguayUzbekistanVanuatuVenezuela, RBVietnamVirgin Islands (U.S.)West Bank and GazaWorldYemen, Rep.ZambiaZimbabwe Linha do tempo:
Nesta escala de tempo está apresentado um gráfico de 1961 ano até 2016 ano Niger. Dados de 1960 ano ausente. O número de observações reais por data: 56.
Fonte (nome):
Indicadores de desenvolvimento mundial
Fonte (organização):
United Nations Population Division, World Population Prospects.
Categorias:
Health, Gender, Social Development
Foi atualizado:
23 abr 2017 ano
Indicadores de alterações dos valores ao longo dos anos
Mínimo:
201.163
1 jan 2016 ano
Máximo:
222.435
1 jan 1993 ano
Na data de observação
Valor
Mudança absoluta
A alteração em relação ao valor anterior
1 jan 1961 ano
204.67
+204.67
0.0%
1 jan 1962 ano
205.735
+1.066
0.52%
1 jan 1963 ano
206.801
+1.066
0.52%
1 jan 1964 ano
206.659
-0.142
-0.07%
1 jan 1965 ano
206.516
-0.142
-0.07%
1 jan 1966 ano
206.374
-0.142
-0.07%
1 jan 1967 ano
206.231
-0.142
-0.07%
1 jan 1968 ano
206.089
-0.142
-0.07%
1 jan 1969 ano
207.687
+1.598
0.78%
1 jan 1970 ano
209.286
+1.598
0.77%
1 jan 1971 ano
210.884
+1.598
0.76%
1 jan 1972 ano
212.483
+1.598
0.76%
1 jan 1973 ano
214.081
+1.598
0.75%
1 jan 1974 ano
215.093
+1.012
0.47%
1 jan 1975 ano
216.105
+1.012
0.47%
1 jan 1976 ano
217.116
+1.012
0.47%
1 jan 1977 ano
218.128
+1.012
0.47%
1 jan 1978 ano
219.14
+1.012
0.46%
1 jan 1979 ano
219.112
-0.028
-0.01%
1 jan 1980 ano
219.085
-0.028
-0.01%
1 jan 1981 ano
219.057
-0.028
-0.01%
1 jan 1982 ano
219.03
-0.028
-0.01%
1 jan 1983 ano
219.002
-0.028
-0.01%
1 jan 1984 ano
219.578
+0.576
0.26%
1 jan 1985 ano
220.153
+0.576
0.26%
1 jan 1986 ano
220.729
+0.576
0.26%
1 jan 1987 ano
221.304
+0.576
0.26%
1 jan 1988 ano
221.88
+0.576
0.26%
1 jan 1989 ano
221.991
+0.111
0.05%
1 jan 1990 ano
222.102
+0.111
0.05%
1 jan 1991 ano
222.213
+0.111
0.05%
1 jan 1992 ano
222.324
+0.111
0.05%
1 jan 1993 ano
222.435
+0.111
0.05%
1 jan 1994 ano
222.129
-0.306
-0.14%
1 jan 1995 ano
221.823
-0.306
-0.14%
1 jan 1996 ano
221.516
-0.306
-0.14%
1 jan 1997 ano
221.21
-0.306
-0.14%
1 jan 1998 ano
220.904
-0.306
-0.14%
1 jan 1999 ano
220.232
-0.672
-0.3%
1 jan 2000 ano
219.561
-0.672
-0.3%
1 jan 2001 ano
218.889
-0.672
-0.31%
1 jan 2002 ano
218.218
-0.672
-0.31%
1 jan 2003 ano
217.546
-0.672
-0.31%
1 jan 2004 ano
216.675
-0.871
-0.4%
1 jan 2005 ano
215.804
-0.871
-0.4%
1 jan 2006 ano
214.933
-0.871
-0.4%
1 jan 2007 ano
214.062
-0.871
-0.41%
1 jan 2008 ano
213.191
-0.871
-0.41%
1 jan 2009 ano
212.25
-0.941
-0.44%
1 jan 2010 ano
211.309
-0.941
-0.44%
1 jan 2011 ano
210.368
-0.941
-0.45%
1 jan 2012 ano
209.427
-0.941
-0.45%
1 jan 2013 ano
208.486
-0.941
-0.45%
1 jan 2014 ano
206.045
-2.441
-1.17%
1 jan 2015 ano
203.604
-2.441
-1.18%
1 jan 2016 ano
201.163
-2.441
-1.2%
Classificação de países por estatísticas atuais por anos


Comentários: