29
/pt/
pt
AIzaSyAYiBZKx7MnpbEhh9jyipgxe19OcubqV5w
April 1, 2024
26274
Early-demographic dividend
EAR
false
2
1
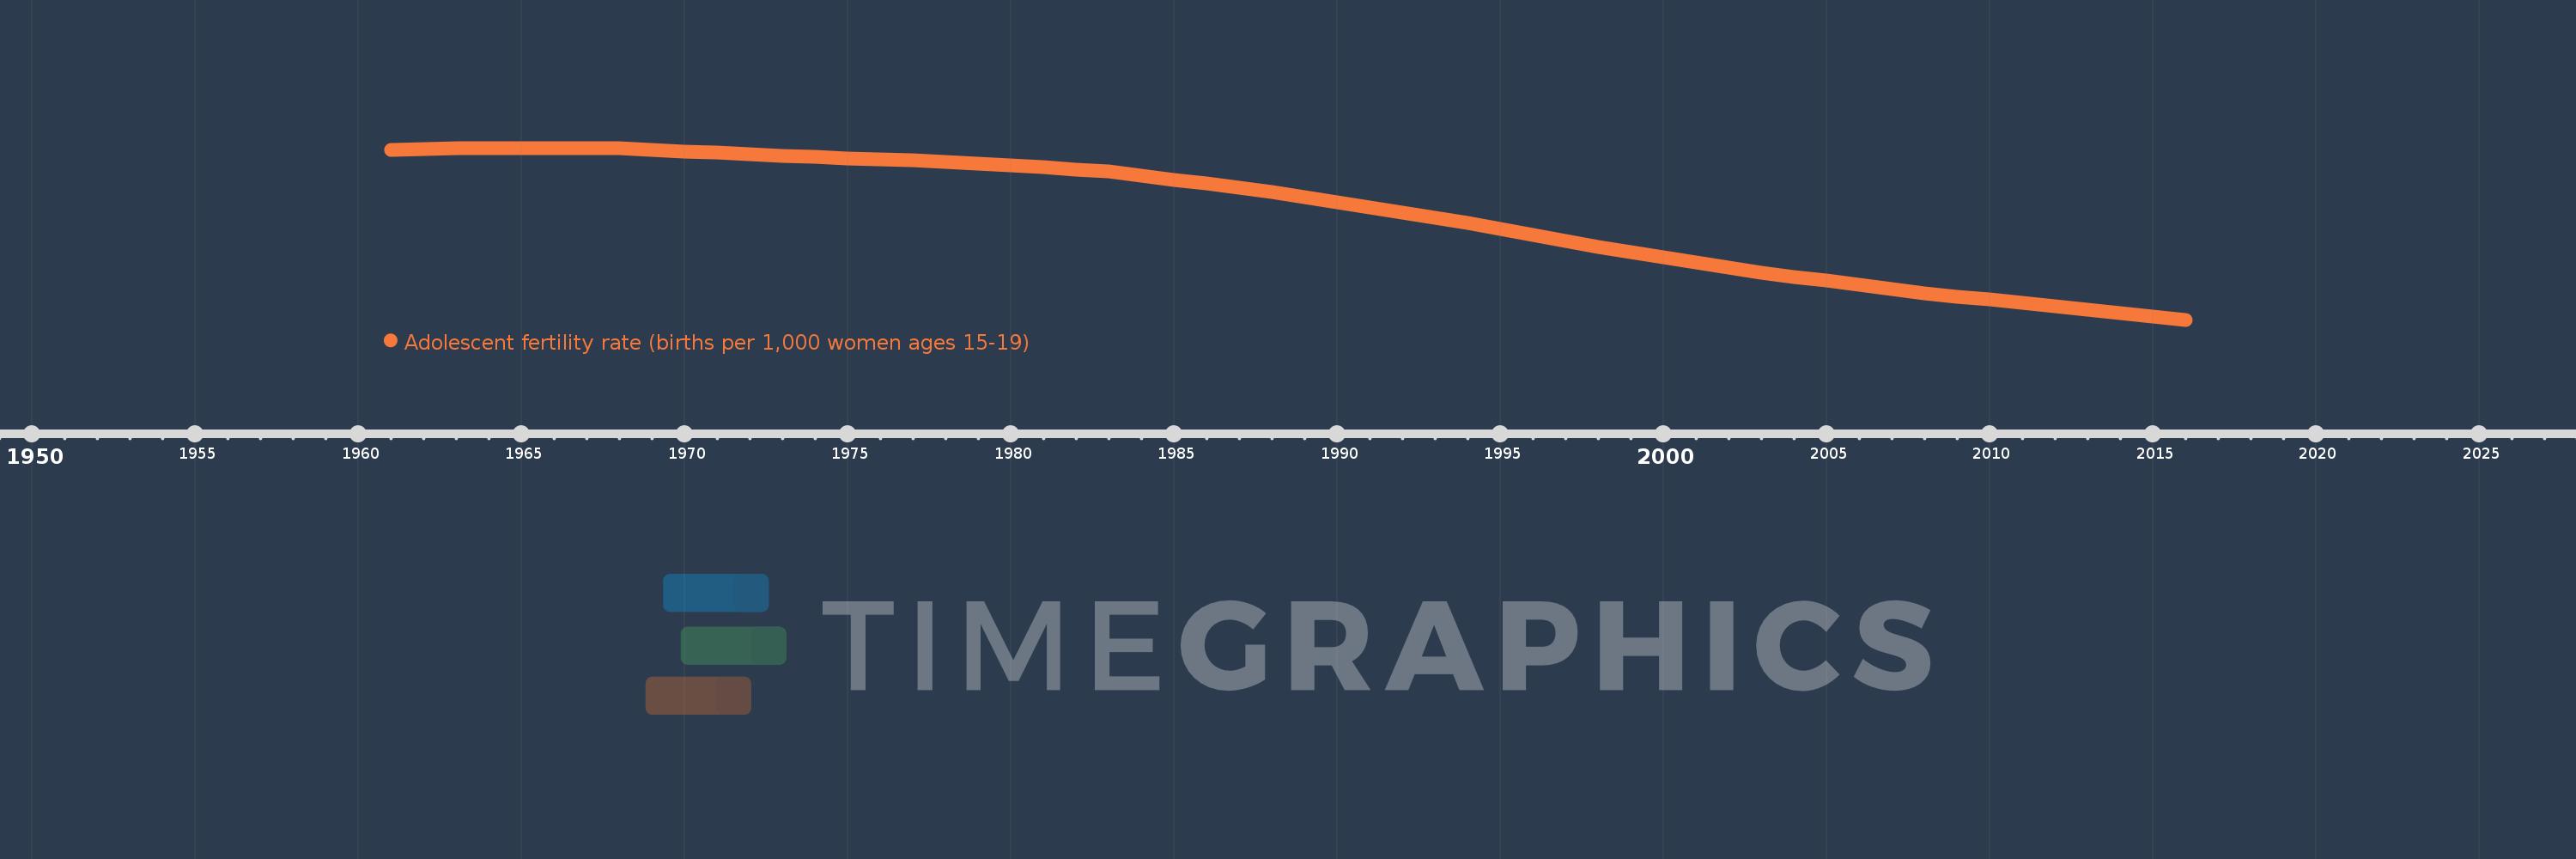
Adolescent fertility rate (births per 1,000 women ages 15-19)
2016,2015,2014,2013,2012,2011,2010,2009,2008,2007,2006,2005,2004,2003,2002,2001,2000,1999,1998,1997,1996,1995,1994,1993,1992,1991,1990,1989,1988,1987,1986,1985,1984,1983,1982,1981,1980,1979,1978,1977,1976,1975,1974,1973,1972,1971,1970,1969,1968,1967,1966,1965,1964,1963,1962,1961
Estas estatísticas em outros países:
AfghanistanAlbaniaAlgeriaAngolaAntigua and BarbudaArab WorldArgentinaArmeniaArubaAustraliaAustriaAzerbaijanBahamas, TheBahrainBangladeshBarbadosBelarusBelgiumBelizeBeninBhutanBoliviaBosnia and HerzegovinaBotswanaBrazilBrunei DarussalamBulgariaBurkina FasoBurundiCabo VerdeCambodiaCameroonCanadaCaribbean small statesCentral African RepublicCentral Europe and the BalticsChadChannel IslandsChileChinaColombiaComorosCongo, Dem. Rep.Congo, Rep.Costa RicaCote d'IvoireCroatiaCubaCuracaoCyprusCzech RepublicDenmarkDjiboutiDominican RepublicEarly-demographic dividendEast Asia & PacificEast Asia & Pacific (excluding high income)East Asia & Pacific (IDA & IBRD countries)EcuadorEgypt, Arab Rep.El SalvadorEquatorial GuineaEritreaEstoniaEthiopiaEuro areaEurope & Central AsiaEurope & Central Asia (excluding high income)Europe & Central Asia (IDA & IBRD countries)European UnionFijiFinlandFragile and conflict affected situationsFranceFrench PolynesiaGabonGambia, TheGeorgiaGermanyGhanaGreeceGrenadaGuamGuatemalaGuineaGuinea-BissauGuyanaHaitiHeavily indebted poor countries (HIPC)High incomeHondurasHong Kong SAR, ChinaHungaryIBRD onlyIcelandIDA & IBRD totalIDA blendIDA onlyIDA totalIndiaIndonesiaIran, Islamic Rep.IraqIrelandIsraelItalyJamaicaJapanJordanKazakhstanKenyaKiribatiKorea, Dem. People’s Rep.Korea, Rep.KuwaitKyrgyz RepublicLao PDRLate-demographic dividendLatin America & Caribbean Latin America & Caribbean (excluding high income)Latin America & the Caribbean (IDA & IBRD countries)LatviaLeast developed countries: UN classificationLebanonLesothoLiberiaLibyaLithuaniaLow & middle incomeLow incomeLower middle incomeLuxembourgMacao SAR, ChinaMacedonia, FYRMadagascarMalawiMalaysiaMaldivesMaliMaltaMauritaniaMauritiusMexicoMicronesia, Fed. Sts.Middle East & North AfricaMiddle East & North Africa (excluding high income)Middle East & North Africa (IDA & IBRD countries)Middle incomeMoldovaMongoliaMontenegroMoroccoMozambiqueMyanmarNamibiaNepalNetherlandsNew CaledoniaNew ZealandNicaraguaNigerNigeriaNorth AmericaNorwayOECD membersOmanOther small statesPacific island small statesPakistanPanamaPapua New GuineaParaguayPeruPhilippinesPolandPortugalPost-demographic dividendPre-demographic dividendPuerto RicoQatarRomaniaRussian FederationRwandaSamoaSao Tome and PrincipeSaudi ArabiaSenegalSerbiaSeychellesSierra LeoneSingaporeSlovak RepublicSloveniaSmall statesSolomon IslandsSomaliaSouth AfricaSouth AsiaSouth Asia (IDA & IBRD)South SudanSpainSri LankaSt. LuciaSt. Vincent and the GrenadinesSub-Saharan Africa Sub-Saharan Africa (excluding high income)Sub-Saharan Africa (IDA & IBRD countries)SudanSurinameSwazilandSwedenSwitzerlandSyrian Arab RepublicTajikistanTanzaniaThailandTimor-LesteTogoTongaTrinidad and TobagoTunisiaTurkeyTurkmenistanUgandaUkraineUnited Arab EmiratesUnited KingdomUnited StatesUpper middle incomeUruguayUzbekistanVanuatuVenezuela, RBVietnamVirgin Islands (U.S.)West Bank and GazaWorldYemen, Rep.ZambiaZimbabwe Linha do tempo:
Nesta escala de tempo está apresentado um gráfico de 1961 ano até 2016 ano Early-demographic dividend. Dados de 1960 ano ausente. O número de observações reais por data: 56.
Fonte (nome):
Indicadores de desenvolvimento mundial
Fonte (organização):
United Nations Population Division, World Population Prospects.
Categorias:
Health, Gender, Social Development
Foi atualizado:
23 abr 2017 ano
Indicadores de alterações dos valores ao longo dos anos
Mínimo:
40.128
1 jan 2016 ano
Máximo:
117.202
1 jan 1965 ano
Na data de observação
Valor
Mudança absoluta
A alteração em relação ao valor anterior
1 jan 1961 ano
116.407
+116.407
0.0%
1 jan 1962 ano
116.715
+0.309
0.27%
1 jan 1963 ano
117.023
+0.308
0.26%
1 jan 1964 ano
117.145
+0.122
0.1%
1 jan 1965 ano
117.202
+0.057
0.05%
1 jan 1966 ano
117.18
-0.021
-0.02%
1 jan 1967 ano
117.091
-0.089
-0.08%
1 jan 1968 ano
116.934
-0.157
-0.13%
1 jan 1969 ano
116.211
-0.723
-0.62%
1 jan 1970 ano
115.56
-0.65
-0.56%
1 jan 1971 ano
115.003
-0.557
-0.48%
1 jan 1972 ano
114.361
-0.643
-0.56%
1 jan 1973 ano
113.797
-0.564
-0.49%
1 jan 1974 ano
113.182
-0.615
-0.54%
1 jan 1975 ano
112.604
-0.578
-0.51%
1 jan 1976 ano
112.039
-0.565
-0.5%
1 jan 1977 ano
111.562
-0.476
-0.43%
1 jan 1978 ano
111.079
-0.483
-0.43%
1 jan 1979 ano
110.218
-0.862
-0.78%
1 jan 1980 ano
109.339
-0.879
-0.8%
1 jan 1981 ano
108.439
-0.9
-0.82%
1 jan 1982 ano
107.49
-0.948
-0.87%
1 jan 1983 ano
106.533
-0.957
-0.89%
1 jan 1984 ano
104.771
-1.762
-1.65%
1 jan 1985 ano
102.979
-1.793
-1.71%
1 jan 1986 ano
101.155
-1.824
-1.77%
1 jan 1987 ano
99.29
-1.865
-1.84%
1 jan 1988 ano
97.408
-1.882
-1.89%
1 jan 1989 ano
95.095
-2.313
-2.37%
1 jan 1990 ano
92.802
-2.293
-2.41%
1 jan 1991 ano
90.553
-2.25
-2.42%
1 jan 1992 ano
88.292
-2.26
-2.5%
1 jan 1993 ano
86.062
-2.23
-2.53%
1 jan 1994 ano
83.415
-2.647
-3.08%
1 jan 1995 ano
80.754
-2.661
-3.19%
1 jan 1996 ano
78.065
-2.689
-3.33%
1 jan 1997 ano
75.351
-2.714
-3.48%
1 jan 1998 ano
72.615
-2.737
-3.63%
1 jan 1999 ano
70.375
-2.24
-3.08%
1 jan 2000 ano
68.134
-2.24
-3.18%
1 jan 2001 ano
65.896
-2.238
-3.29%
1 jan 2002 ano
63.628
-2.268
-3.44%
1 jan 2003 ano
61.352
-2.276
-3.58%
1 jan 2004 ano
59.443
-1.909
-3.11%
1 jan 2005 ano
57.556
-1.887
-3.17%
1 jan 2006 ano
55.697
-1.859
-3.23%
1 jan 2007 ano
53.869
-1.828
-3.28%
1 jan 2008 ano
52.055
-1.814
-3.37%
1 jan 2009 ano
50.598
-1.457
-2.8%
1 jan 2010 ano
49.133
-1.465
-2.9%
1 jan 2011 ano
47.646
-1.487
-3.03%
1 jan 2012 ano
46.139
-1.507
-3.16%
1 jan 2013 ano
44.608
-1.531
-3.32%
1 jan 2014 ano
43.133
-1.475
-3.31%
1 jan 2015 ano
41.638
-1.495
-3.47%
1 jan 2016 ano
40.128
-1.51
-3.63%
Classificação de países por estatísticas atuais por anos


Comentários: