29
/pt/
pt
AIzaSyAYiBZKx7MnpbEhh9jyipgxe19OcubqV5w
April 1, 2024
286803
Zimbabwe
ZWE
true
2
1
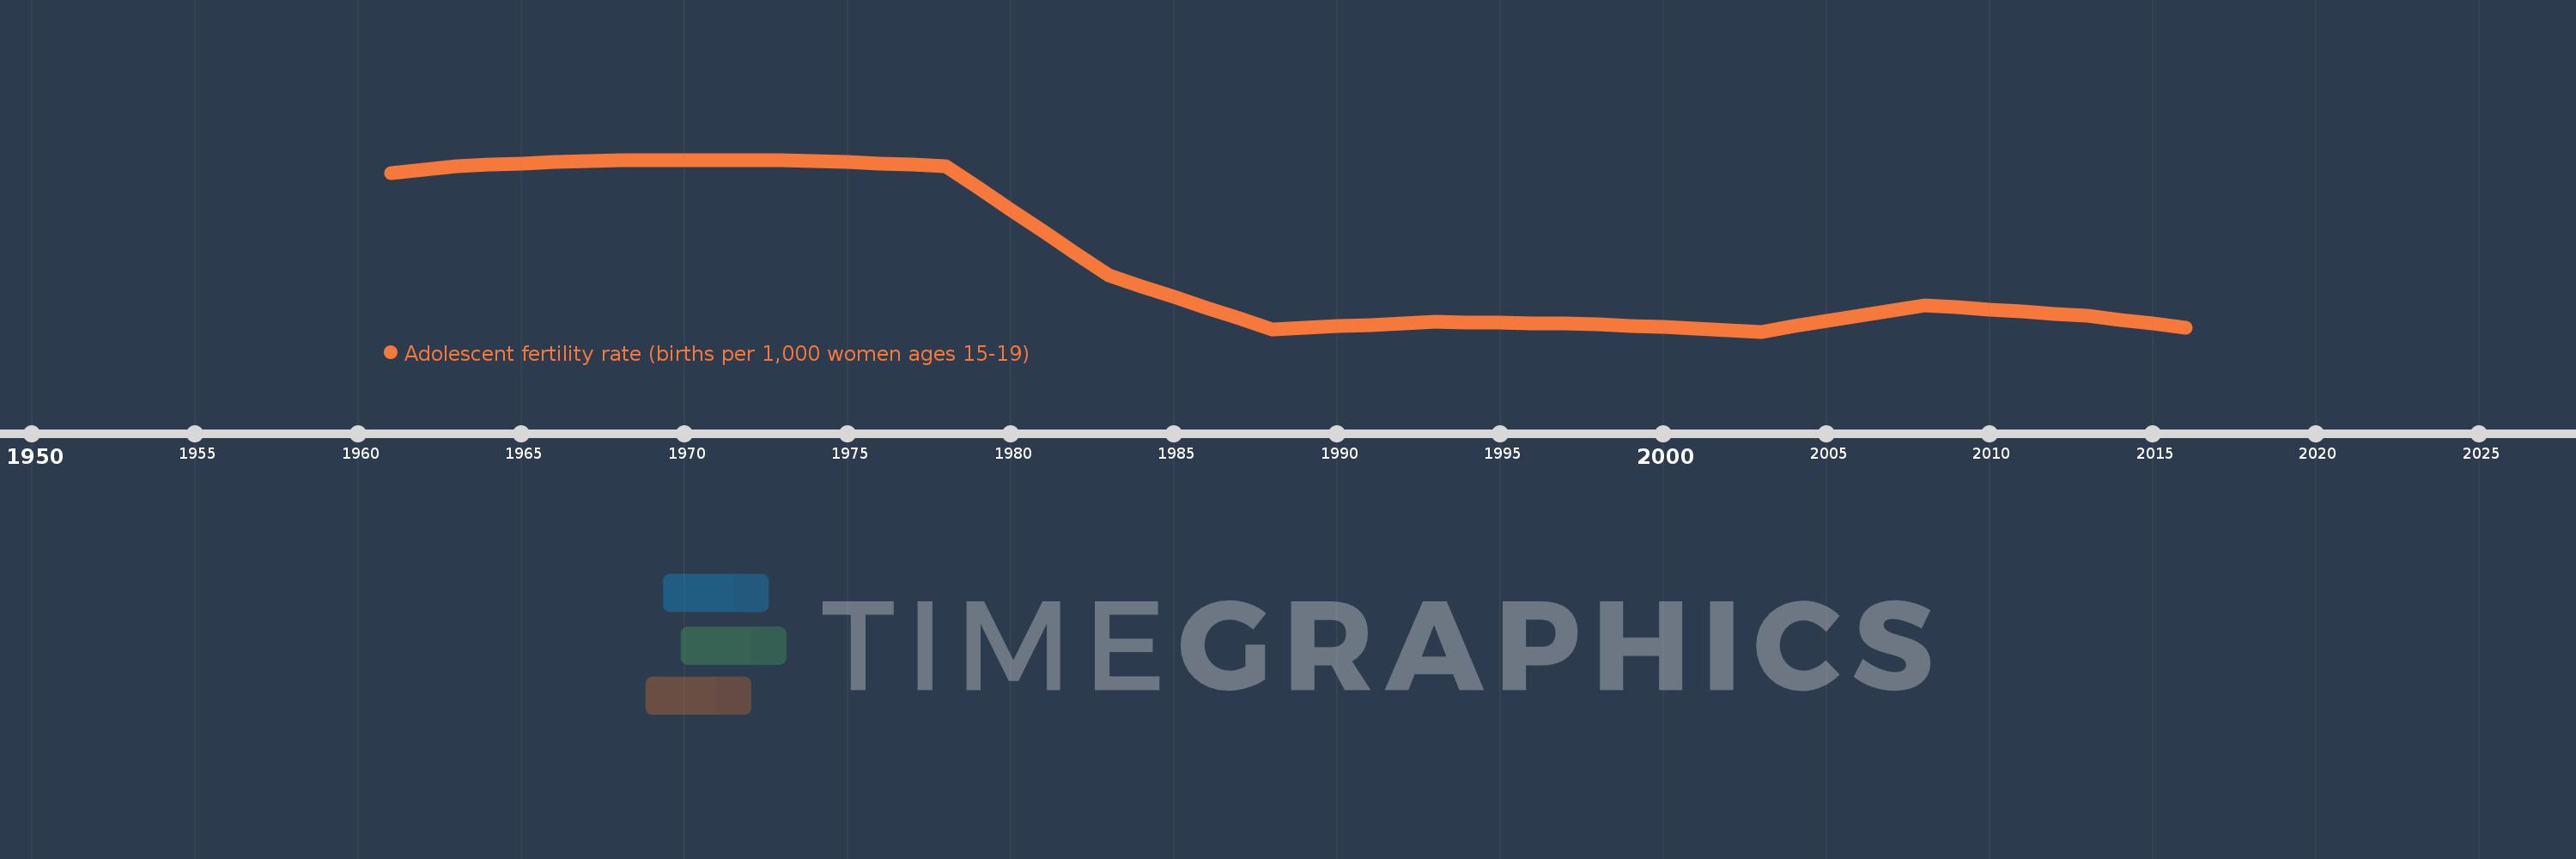
Adolescent fertility rate (births per 1,000 women ages 15-19)
2016,2015,2014,2013,2012,2011,2010,2009,2008,2007,2006,2005,2004,2003,2002,2001,2000,1999,1998,1997,1996,1995,1994,1993,1992,1991,1990,1989,1988,1987,1986,1985,1984,1983,1982,1981,1980,1979,1978,1977,1976,1975,1974,1973,1972,1971,1970,1969,1968,1967,1966,1965,1964,1963,1962,1961
Estas estatísticas em outros países:
AfghanistanAlbaniaAlgeriaAngolaAntigua and BarbudaArab WorldArgentinaArmeniaArubaAustraliaAustriaAzerbaijanBahamas, TheBahrainBangladeshBarbadosBelarusBelgiumBelizeBeninBhutanBoliviaBosnia and HerzegovinaBotswanaBrazilBrunei DarussalamBulgariaBurkina FasoBurundiCabo VerdeCambodiaCameroonCanadaCaribbean small statesCentral African RepublicCentral Europe and the BalticsChadChannel IslandsChileChinaColombiaComorosCongo, Dem. Rep.Congo, Rep.Costa RicaCote d'IvoireCroatiaCubaCuracaoCyprusCzech RepublicDenmarkDjiboutiDominican RepublicEarly-demographic dividendEast Asia & PacificEast Asia & Pacific (excluding high income)East Asia & Pacific (IDA & IBRD countries)EcuadorEgypt, Arab Rep.El SalvadorEquatorial GuineaEritreaEstoniaEthiopiaEuro areaEurope & Central AsiaEurope & Central Asia (excluding high income)Europe & Central Asia (IDA & IBRD countries)European UnionFijiFinlandFragile and conflict affected situationsFranceFrench PolynesiaGabonGambia, TheGeorgiaGermanyGhanaGreeceGrenadaGuamGuatemalaGuineaGuinea-BissauGuyanaHaitiHeavily indebted poor countries (HIPC)High incomeHondurasHong Kong SAR, ChinaHungaryIBRD onlyIcelandIDA & IBRD totalIDA blendIDA onlyIDA totalIndiaIndonesiaIran, Islamic Rep.IraqIrelandIsraelItalyJamaicaJapanJordanKazakhstanKenyaKiribatiKorea, Dem. People’s Rep.Korea, Rep.KuwaitKyrgyz RepublicLao PDRLate-demographic dividendLatin America & Caribbean Latin America & Caribbean (excluding high income)Latin America & the Caribbean (IDA & IBRD countries)LatviaLeast developed countries: UN classificationLebanonLesothoLiberiaLibyaLithuaniaLow & middle incomeLow incomeLower middle incomeLuxembourgMacao SAR, ChinaMacedonia, FYRMadagascarMalawiMalaysiaMaldivesMaliMaltaMauritaniaMauritiusMexicoMicronesia, Fed. Sts.Middle East & North AfricaMiddle East & North Africa (excluding high income)Middle East & North Africa (IDA & IBRD countries)Middle incomeMoldovaMongoliaMontenegroMoroccoMozambiqueMyanmarNamibiaNepalNetherlandsNew CaledoniaNew ZealandNicaraguaNigerNigeriaNorth AmericaNorwayOECD membersOmanOther small statesPacific island small statesPakistanPanamaPapua New GuineaParaguayPeruPhilippinesPolandPortugalPost-demographic dividendPre-demographic dividendPuerto RicoQatarRomaniaRussian FederationRwandaSamoaSao Tome and PrincipeSaudi ArabiaSenegalSerbiaSeychellesSierra LeoneSingaporeSlovak RepublicSloveniaSmall statesSolomon IslandsSomaliaSouth AfricaSouth AsiaSouth Asia (IDA & IBRD)South SudanSpainSri LankaSt. LuciaSt. Vincent and the GrenadinesSub-Saharan Africa Sub-Saharan Africa (excluding high income)Sub-Saharan Africa (IDA & IBRD countries)SudanSurinameSwazilandSwedenSwitzerlandSyrian Arab RepublicTajikistanTanzaniaThailandTimor-LesteTogoTongaTrinidad and TobagoTunisiaTurkeyTurkmenistanUgandaUkraineUnited Arab EmiratesUnited KingdomUnited StatesUpper middle incomeUruguayUzbekistanVanuatuVenezuela, RBVietnamVirgin Islands (U.S.)West Bank and GazaWorldYemen, Rep.ZambiaZimbabwe Linha do tempo:
Nesta escala de tempo está apresentado um gráfico de 1961 ano até 2016 ano Zimbabwe. Dados de 1960 ano ausente. O número de observações reais por data: 56.
Fonte (nome):
Indicadores de desenvolvimento mundial
Fonte (organização):
United Nations Population Division, World Population Prospects.
Categorias:
Health, Gender, Social Development
Foi atualizado:
23 abr 2017 ano
Indicadores de alterações dos valores ao longo dos anos
Mínimo:
107.269
1 jan 2003 ano
Máximo:
174.048
1 jan 1968 ano
Na data de observação
Valor
Mudança absoluta
A alteração em relação ao valor anterior
1 jan 1961 ano
168.874
+168.874
0.0%
1 jan 1962 ano
170.285
+1.411
0.84%
1 jan 1963 ano
171.696
+1.411
0.83%
1 jan 1964 ano
172.166
+0.47
0.27%
1 jan 1965 ano
172.637
+0.47
0.27%
1 jan 1966 ano
173.107
+0.47
0.27%
1 jan 1967 ano
173.578
+0.47
0.27%
1 jan 1968 ano
174.048
+0.47
0.27%
1 jan 1969 ano
174.048
0.0
0.0%
1 jan 1970 ano
174.048
0.0
0.0%
1 jan 1971 ano
174.048
0.0
0.0%
1 jan 1972 ano
174.048
0.0
0.0%
1 jan 1973 ano
174.048
0.0
0.0%
1 jan 1974 ano
173.578
-0.47
-0.27%
1 jan 1975 ano
173.107
-0.47
-0.27%
1 jan 1976 ano
172.637
-0.47
-0.27%
1 jan 1977 ano
172.166
-0.47
-0.27%
1 jan 1978 ano
171.696
-0.47
-0.27%
1 jan 1979 ano
163.16
-8.536
-4.97%
1 jan 1980 ano
154.624
-8.536
-5.23%
1 jan 1981 ano
146.089
-8.536
-5.52%
1 jan 1982 ano
137.553
-8.536
-5.84%
1 jan 1983 ano
129.017
-8.536
-6.21%
1 jan 1984 ano
124.867
-4.15
-3.22%
1 jan 1985 ano
120.717
-4.15
-3.32%
1 jan 1986 ano
116.567
-4.15
-3.44%
1 jan 1987 ano
112.417
-4.15
-3.56%
1 jan 1988 ano
108.267
-4.15
-3.69%
1 jan 1989 ano
108.818
+0.551
0.51%
1 jan 1990 ano
109.368
+0.551
0.51%
1 jan 1991 ano
109.919
+0.551
0.5%
1 jan 1992 ano
110.469
+0.551
0.5%
1 jan 1993 ano
111.02
+0.551
0.5%
1 jan 1994 ano
110.841
-0.179
-0.16%
1 jan 1995 ano
110.662
-0.179
-0.16%
1 jan 1996 ano
110.482
-0.179
-0.16%
1 jan 1997 ano
110.303
-0.179
-0.16%
1 jan 1998 ano
110.124
-0.179
-0.16%
1 jan 1999 ano
109.553
-0.571
-0.52%
1 jan 2000 ano
108.982
-0.571
-0.52%
1 jan 2001 ano
108.411
-0.571
-0.52%
1 jan 2002 ano
107.84
-0.571
-0.53%
1 jan 2003 ano
107.269
-0.571
-0.53%
1 jan 2004 ano
109.316
+2.047
1.91%
1 jan 2005 ano
111.363
+2.047
1.87%
1 jan 2006 ano
113.411
+2.047
1.84%
1 jan 2007 ano
115.458
+2.047
1.81%
1 jan 2008 ano
117.505
+2.047
1.77%
1 jan 2009 ano
116.67
-0.835
-0.71%
1 jan 2010 ano
115.835
-0.835
-0.72%
1 jan 2011 ano
115.001
-0.835
-0.72%
1 jan 2012 ano
114.166
-0.835
-0.73%
1 jan 2013 ano
113.331
-0.835
-0.73%
1 jan 2014 ano
111.866
-1.465
-1.29%
1 jan 2015 ano
110.402
-1.465
-1.31%
1 jan 2016 ano
108.937
-1.465
-1.33%
Classificação de países por estatísticas atuais por anos


Comentários: