29
/pt/
pt
AIzaSyAYiBZKx7MnpbEhh9jyipgxe19OcubqV5w
April 1, 2024
220418
Paraguay
PRY
true
2
1
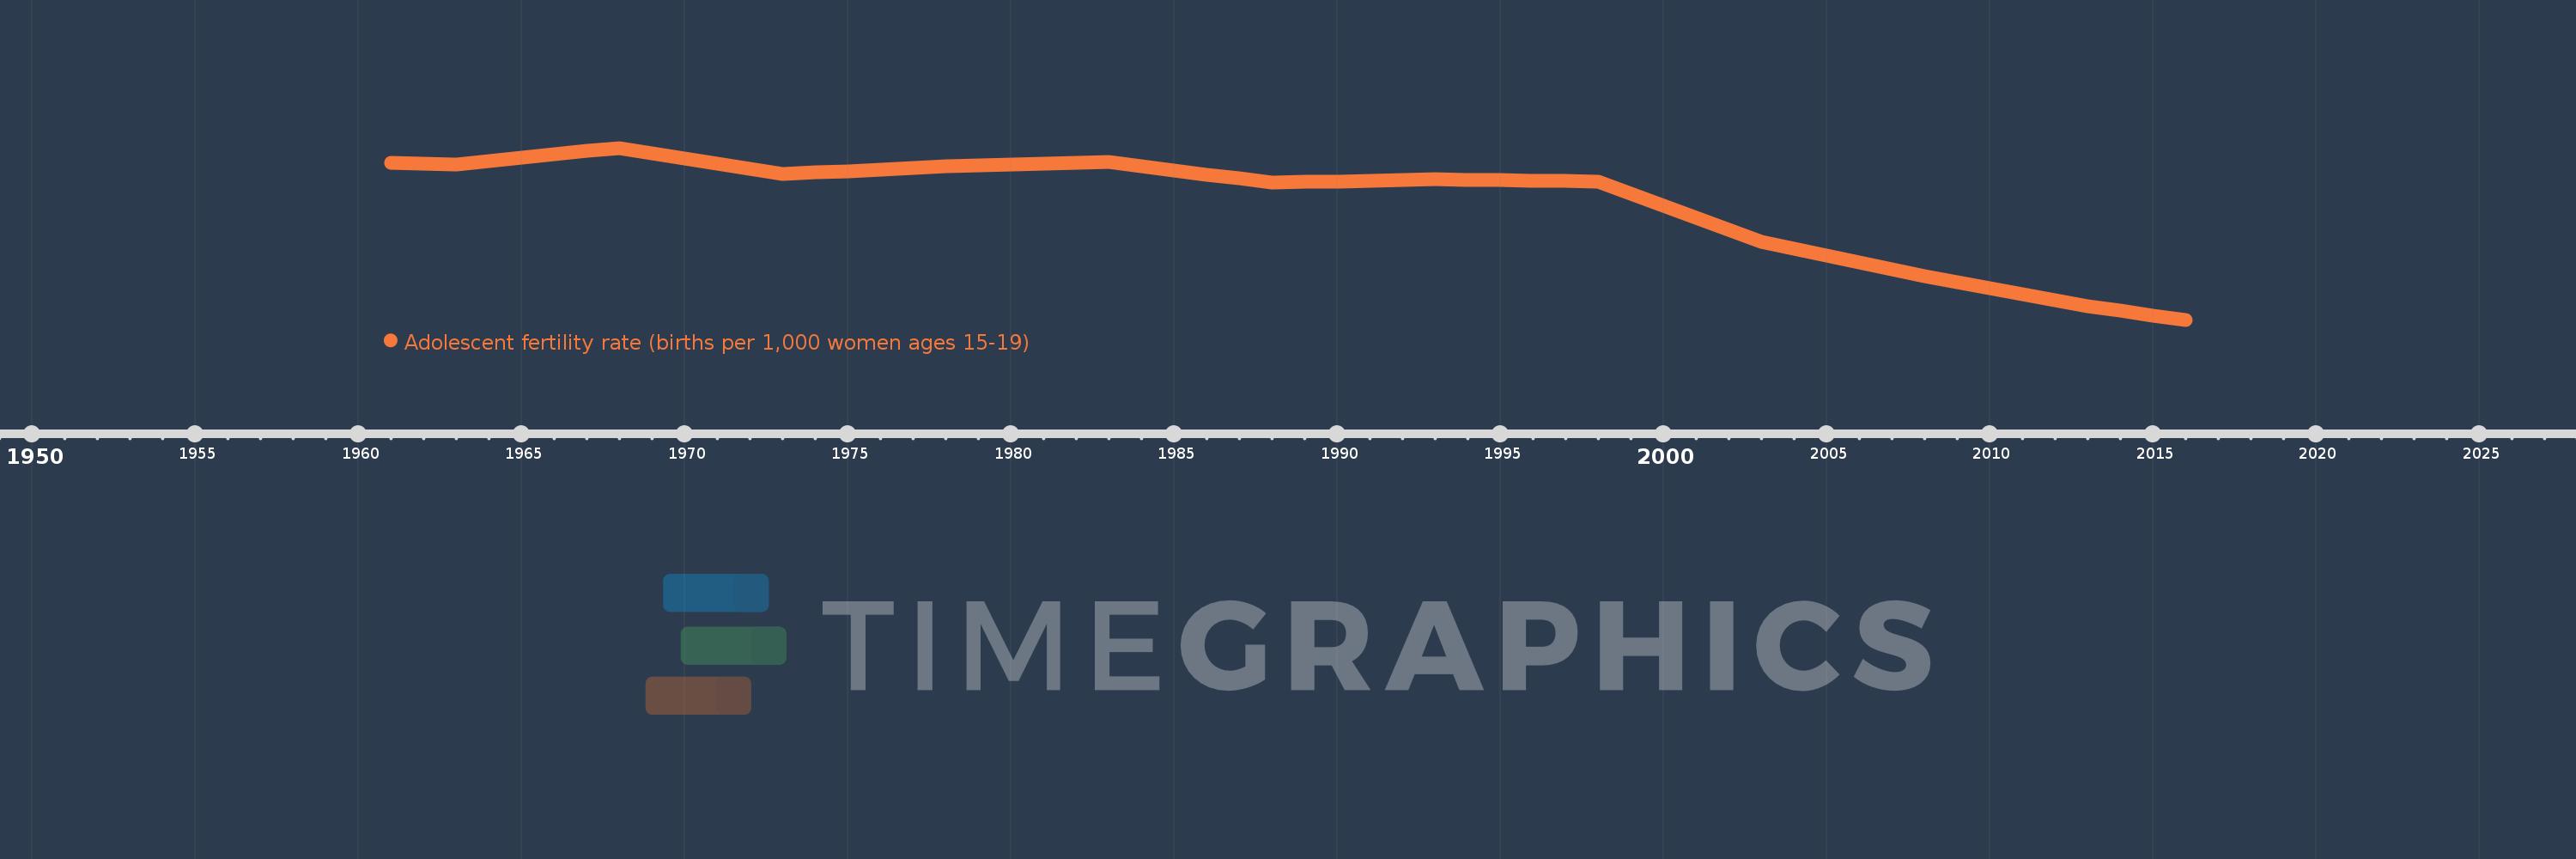
Adolescent fertility rate (births per 1,000 women ages 15-19)
2016,2015,2014,2013,2012,2011,2010,2009,2008,2007,2006,2005,2004,2003,2002,2001,2000,1999,1998,1997,1996,1995,1994,1993,1992,1991,1990,1989,1988,1987,1986,1985,1984,1983,1982,1981,1980,1979,1978,1977,1976,1975,1974,1973,1972,1971,1970,1969,1968,1967,1966,1965,1964,1963,1962,1961
Estas estatísticas em outros países:
AfghanistanAlbaniaAlgeriaAngolaAntigua and BarbudaArab WorldArgentinaArmeniaArubaAustraliaAustriaAzerbaijanBahamas, TheBahrainBangladeshBarbadosBelarusBelgiumBelizeBeninBhutanBoliviaBosnia and HerzegovinaBotswanaBrazilBrunei DarussalamBulgariaBurkina FasoBurundiCabo VerdeCambodiaCameroonCanadaCaribbean small statesCentral African RepublicCentral Europe and the BalticsChadChannel IslandsChileChinaColombiaComorosCongo, Dem. Rep.Congo, Rep.Costa RicaCote d'IvoireCroatiaCubaCuracaoCyprusCzech RepublicDenmarkDjiboutiDominican RepublicEarly-demographic dividendEast Asia & PacificEast Asia & Pacific (excluding high income)East Asia & Pacific (IDA & IBRD countries)EcuadorEgypt, Arab Rep.El SalvadorEquatorial GuineaEritreaEstoniaEthiopiaEuro areaEurope & Central AsiaEurope & Central Asia (excluding high income)Europe & Central Asia (IDA & IBRD countries)European UnionFijiFinlandFragile and conflict affected situationsFranceFrench PolynesiaGabonGambia, TheGeorgiaGermanyGhanaGreeceGrenadaGuamGuatemalaGuineaGuinea-BissauGuyanaHaitiHeavily indebted poor countries (HIPC)High incomeHondurasHong Kong SAR, ChinaHungaryIBRD onlyIcelandIDA & IBRD totalIDA blendIDA onlyIDA totalIndiaIndonesiaIran, Islamic Rep.IraqIrelandIsraelItalyJamaicaJapanJordanKazakhstanKenyaKiribatiKorea, Dem. People’s Rep.Korea, Rep.KuwaitKyrgyz RepublicLao PDRLate-demographic dividendLatin America & Caribbean Latin America & Caribbean (excluding high income)Latin America & the Caribbean (IDA & IBRD countries)LatviaLeast developed countries: UN classificationLebanonLesothoLiberiaLibyaLithuaniaLow & middle incomeLow incomeLower middle incomeLuxembourgMacao SAR, ChinaMacedonia, FYRMadagascarMalawiMalaysiaMaldivesMaliMaltaMauritaniaMauritiusMexicoMicronesia, Fed. Sts.Middle East & North AfricaMiddle East & North Africa (excluding high income)Middle East & North Africa (IDA & IBRD countries)Middle incomeMoldovaMongoliaMontenegroMoroccoMozambiqueMyanmarNamibiaNepalNetherlandsNew CaledoniaNew ZealandNicaraguaNigerNigeriaNorth AmericaNorwayOECD membersOmanOther small statesPacific island small statesPakistanPanamaPapua New GuineaParaguayPeruPhilippinesPolandPortugalPost-demographic dividendPre-demographic dividendPuerto RicoQatarRomaniaRussian FederationRwandaSamoaSao Tome and PrincipeSaudi ArabiaSenegalSerbiaSeychellesSierra LeoneSingaporeSlovak RepublicSloveniaSmall statesSolomon IslandsSomaliaSouth AfricaSouth AsiaSouth Asia (IDA & IBRD)South SudanSpainSri LankaSt. LuciaSt. Vincent and the GrenadinesSub-Saharan Africa Sub-Saharan Africa (excluding high income)Sub-Saharan Africa (IDA & IBRD countries)SudanSurinameSwazilandSwedenSwitzerlandSyrian Arab RepublicTajikistanTanzaniaThailandTimor-LesteTogoTongaTrinidad and TobagoTunisiaTurkeyTurkmenistanUgandaUkraineUnited Arab EmiratesUnited KingdomUnited StatesUpper middle incomeUruguayUzbekistanVanuatuVenezuela, RBVietnamVirgin Islands (U.S.)West Bank and GazaWorldYemen, Rep.ZambiaZimbabwe Linha do tempo:
Nesta escala de tempo está apresentado um gráfico de 1961 ano até 2016 ano Paraguay. Dados de 1960 ano ausente. O número de observações reais por data: 56.
Fonte (nome):
Indicadores de desenvolvimento mundial
Fonte (organização):
United Nations Population Division, World Population Prospects.
Categorias:
Health, Gender, Social Development
Foi atualizado:
23 abr 2017 ano
Indicadores de alterações dos valores ao longo dos anos
Mínimo:
56.855
1 jan 2016 ano
Máximo:
100.404
1 jan 1968 ano
Na data de observação
Valor
Mudança absoluta
A alteração em relação ao valor anterior
1 jan 1961 ano
96.582
+96.582
0.0%
1 jan 1962 ano
96.44
-0.141
-0.15%
1 jan 1963 ano
96.299
-0.141
-0.15%
1 jan 1964 ano
97.12
+0.821
0.85%
1 jan 1965 ano
97.941
+0.821
0.85%
1 jan 1966 ano
98.762
+0.821
0.84%
1 jan 1967 ano
99.583
+0.821
0.83%
1 jan 1968 ano
100.404
+0.821
0.82%
1 jan 1969 ano
99.084
-1.32
-1.31%
1 jan 1970 ano
97.765
-1.32
-1.33%
1 jan 1971 ano
96.445
-1.32
-1.35%
1 jan 1972 ano
95.126
-1.32
-1.37%
1 jan 1973 ano
93.806
-1.32
-1.39%
1 jan 1974 ano
94.185
+0.379
0.4%
1 jan 1975 ano
94.564
+0.379
0.4%
1 jan 1976 ano
94.943
+0.379
0.4%
1 jan 1977 ano
95.322
+0.379
0.4%
1 jan 1978 ano
95.701
+0.379
0.4%
1 jan 1979 ano
95.918
+0.217
0.23%
1 jan 1980 ano
96.136
+0.217
0.23%
1 jan 1981 ano
96.353
+0.217
0.23%
1 jan 1982 ano
96.571
+0.217
0.23%
1 jan 1983 ano
96.788
+0.217
0.23%
1 jan 1984 ano
95.751
-1.037
-1.07%
1 jan 1985 ano
94.714
-1.037
-1.08%
1 jan 1986 ano
93.677
-1.037
-1.09%
1 jan 1987 ano
92.64
-1.037
-1.11%
1 jan 1988 ano
91.603
-1.037
-1.12%
1 jan 1989 ano
91.763
+0.16
0.17%
1 jan 1990 ano
91.923
+0.16
0.17%
1 jan 1991 ano
92.084
+0.16
0.17%
1 jan 1992 ano
92.244
+0.16
0.17%
1 jan 1993 ano
92.404
+0.16
0.17%
1 jan 1994 ano
92.304
-0.1
-0.11%
1 jan 1995 ano
92.203
-0.1
-0.11%
1 jan 1996 ano
92.103
-0.1
-0.11%
1 jan 1997 ano
92.002
-0.1
-0.11%
1 jan 1998 ano
91.902
-0.1
-0.11%
1 jan 1999 ano
88.845
-3.057
-3.33%
1 jan 2000 ano
85.789
-3.057
-3.44%
1 jan 2001 ano
82.732
-3.057
-3.56%
1 jan 2002 ano
79.676
-3.057
-3.69%
1 jan 2003 ano
76.619
-3.057
-3.84%
1 jan 2004 ano
74.861
-1.758
-2.29%
1 jan 2005 ano
73.102
-1.758
-2.35%
1 jan 2006 ano
71.344
-1.758
-2.41%
1 jan 2007 ano
69.585
-1.758
-2.46%
1 jan 2008 ano
67.827
-1.758
-2.53%
1 jan 2009 ano
66.31
-1.517
-2.24%
1 jan 2010 ano
64.793
-1.517
-2.29%
1 jan 2011 ano
63.275
-1.517
-2.34%
1 jan 2012 ano
61.758
-1.517
-2.4%
1 jan 2013 ano
60.241
-1.517
-2.46%
1 jan 2014 ano
59.112
-1.129
-1.87%
1 jan 2015 ano
57.984
-1.129
-1.91%
1 jan 2016 ano
56.855
-1.129
-1.95%
Classificação de países por estatísticas atuais por anos


Comentários: