29
/pt/
pt
AIzaSyAYiBZKx7MnpbEhh9jyipgxe19OcubqV5w
April 1, 2024
67413
Angola
AGO
true
2
1
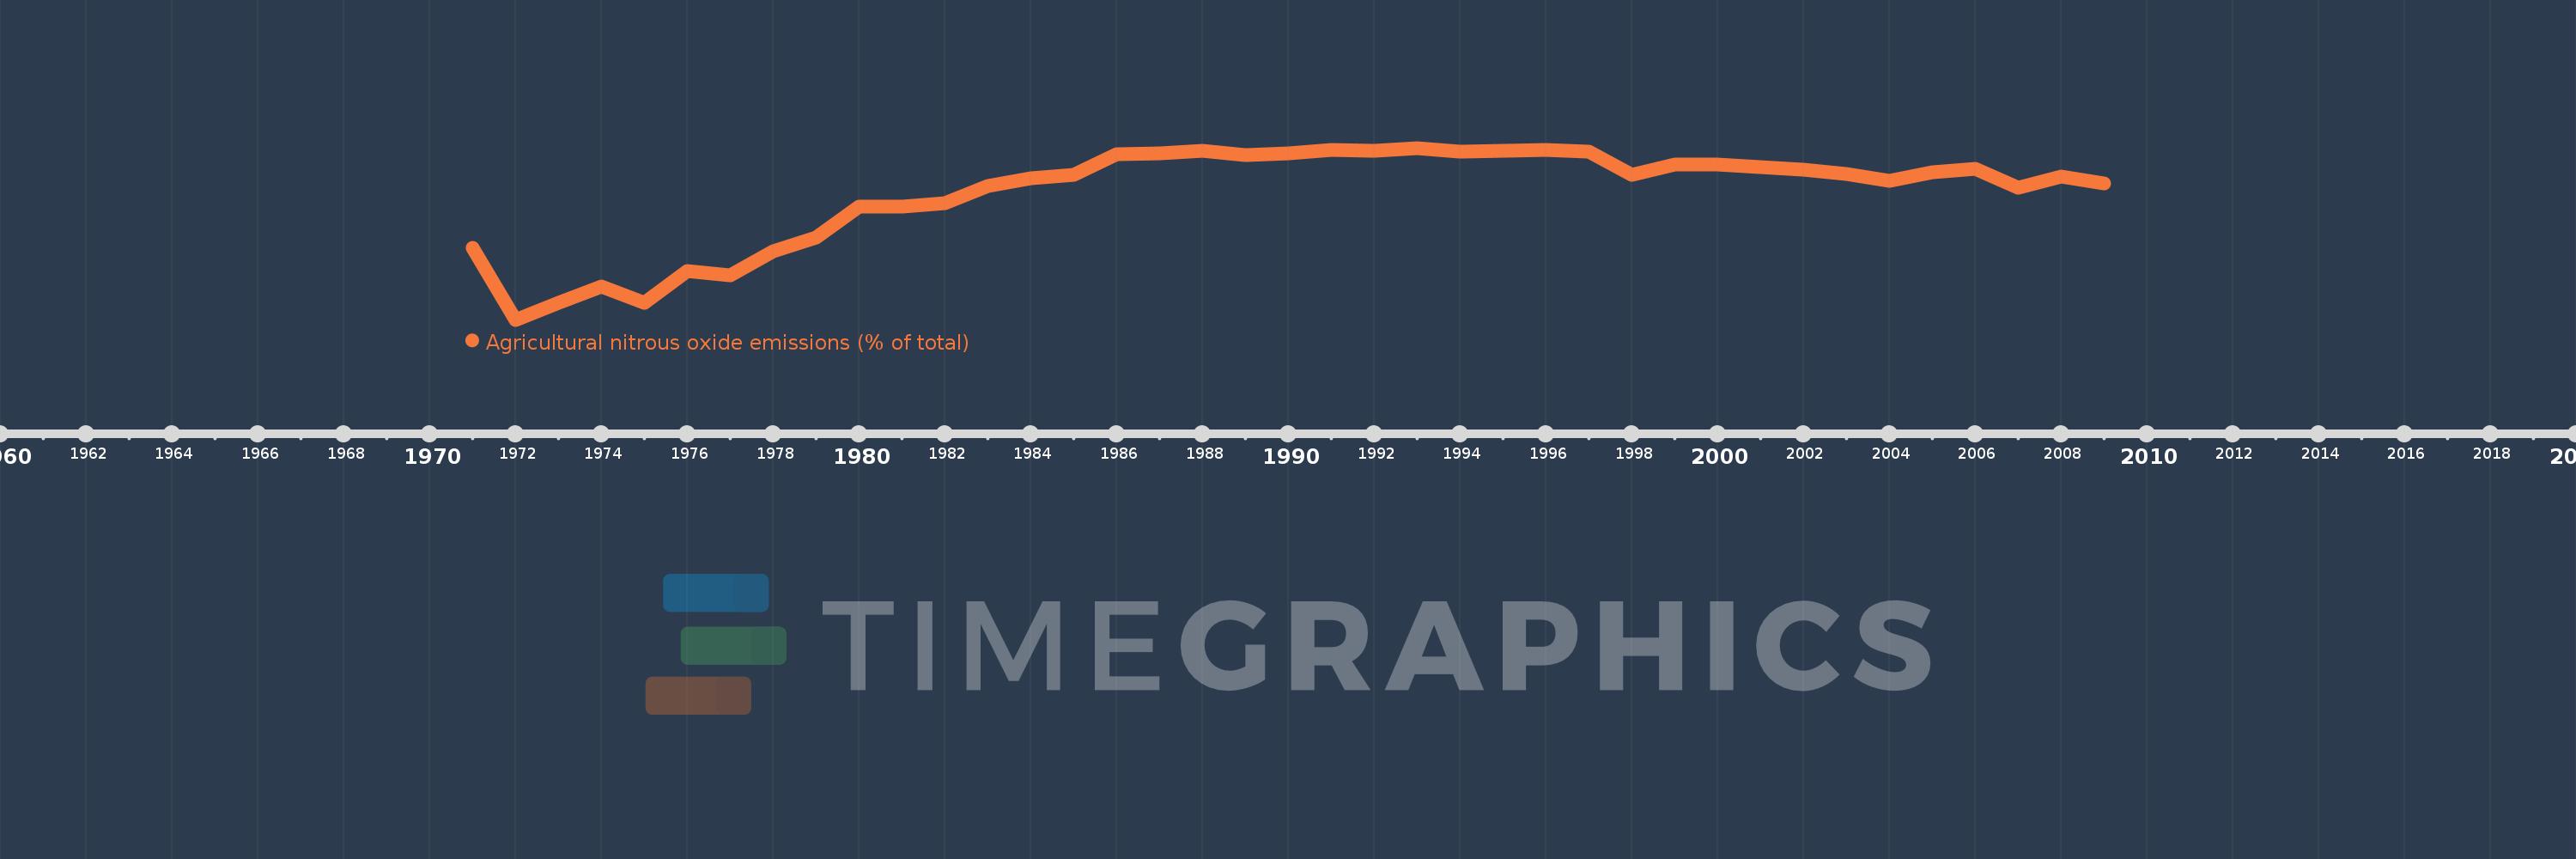
Agricultural nitrous oxide emissions (% of total)
2009,2008,2007,2006,2005,2004,2003,2002,2001,2000,1999,1998,1997,1996,1995,1994,1993,1992,1991,1990,1989,1988,1987,1986,1985,1984,1983,1982,1981,1980,1979,1978,1977,1976,1975,1974,1973,1972,1971
Estas estatísticas em outros países:
AfghanistanAlbaniaAlgeriaAmerican SamoaAndorraAngolaAntigua and BarbudaArab WorldArgentinaArmeniaArubaAustraliaAustriaAzerbaijanBahamas, TheBahrainBangladeshBarbadosBelarusBelgiumBelizeBeninBermudaBhutanBoliviaBosnia and HerzegovinaBotswanaBrazilBritish Virgin IslandsBrunei DarussalamBulgariaBurkina FasoBurundiCabo VerdeCambodiaCameroonCanadaCaribbean small statesCayman IslandsCentral African RepublicCentral Europe and the BalticsChadChileChinaColombiaComorosCongo, Dem. Rep.Congo, Rep.Costa RicaCote d'IvoireCroatiaCubaCyprusCzech RepublicDenmarkDjiboutiDominicaDominican RepublicEarly-demographic dividendEast Asia & PacificEast Asia & Pacific (excluding high income)East Asia & Pacific (IDA & IBRD countries)EcuadorEgypt, Arab Rep.El SalvadorEquatorial GuineaEritreaEstoniaEthiopiaEuro areaEurope & Central AsiaEurope & Central Asia (excluding high income)Europe & Central Asia (IDA & IBRD countries)European UnionFaroe IslandsFijiFinlandFragile and conflict affected situationsFranceFrench PolynesiaGabonGambia, TheGeorgiaGermanyGhanaGibraltarGreeceGreenlandGrenadaGuamGuatemalaGuineaGuinea-BissauGuyanaHaitiHeavily indebted poor countries (HIPC)High incomeHondurasHong Kong SAR, ChinaHungaryIBRD onlyIcelandIDA & IBRD totalIDA blendIDA onlyIDA totalIndiaIndonesiaIran, Islamic Rep.IraqIrelandIsraelItalyJamaicaJapanJordanKazakhstanKenyaKiribatiKorea, Dem. People’s Rep.Korea, Rep.KuwaitKyrgyz RepublicLao PDRLate-demographic dividendLatin America & Caribbean Latin America & Caribbean (excluding high income)Latin America & the Caribbean (IDA & IBRD countries)LatviaLeast developed countries: UN classificationLebanonLesothoLiberiaLibyaLithuaniaLow & middle incomeLow incomeLower middle incomeLuxembourgMacao SAR, ChinaMacedonia, FYRMadagascarMalawiMalaysiaMaldivesMaliMaltaMarshall IslandsMauritaniaMauritiusMexicoMicronesia, Fed. Sts.Middle East & North AfricaMiddle East & North Africa (excluding high income)Middle East & North Africa (IDA & IBRD countries)Middle incomeMoldovaMongoliaMoroccoMozambiqueMyanmarNamibiaNauruNepalNetherlandsNew CaledoniaNew ZealandNicaraguaNigerNigeriaNorth AmericaNorthern Mariana IslandsNorwayOECD membersOmanOther small statesPacific island small statesPakistanPalauPanamaPapua New GuineaParaguayPeruPhilippinesPolandPortugalPost-demographic dividendPre-demographic dividendPuerto RicoQatarRomaniaRussian FederationRwandaSamoaSao Tome and PrincipeSaudi ArabiaSenegalSerbiaSeychellesSierra LeoneSingaporeSlovak RepublicSloveniaSmall statesSolomon IslandsSomaliaSouth AfricaSouth AsiaSouth Asia (IDA & IBRD)SpainSri LankaSt. Kitts and NevisSt. LuciaSt. Vincent and the GrenadinesSub-Saharan Africa Sub-Saharan Africa (excluding high income)Sub-Saharan Africa (IDA & IBRD countries)SudanSurinameSwazilandSwedenSwitzerlandSyrian Arab RepublicTajikistanTanzaniaThailandTimor-LesteTogoTongaTrinidad and TobagoTunisiaTurkeyTurkmenistanTurks and Caicos IslandsTuvaluUgandaUkraineUnited Arab EmiratesUnited KingdomUnited StatesUpper middle incomeUruguayUzbekistanVanuatuVenezuela, RBVietnamVirgin Islands (U.S.)WorldYemen, Rep.ZambiaZimbabwe Linha do tempo:
Nesta escala de tempo está apresentado um gráfico de 1971 ano até 2009 ano Angola. Dados de 1970 ano ausente. O número de observações reais por data: 39.
Fonte (nome):
Indicadores de desenvolvimento mundial
Fonte (organização):
World Bank staff estimates from original source: European Commission, Joint Research Centre (JRC)/Netherlands Environmental Assessment Agency (PBL). Emission Database for Global Atmospheric Research (EDGAR): http://edgar.jrc.ec.europa.eu/.
Categorias:
Agriculture & Rural Development, Environment
Foi atualizado:
23 abr 2017 ano
Indicadores de alterações dos valores ao longo dos anos
Mínimo:
52.745
1 jan 1972 ano
Máximo:
88.683
1 jan 1993 ano
Na data de observação
Valor
Mudança absoluta
A alteração em relação ao valor anterior
1 jan 1971 ano
67.855
+67.855
0.0%
1 jan 1972 ano
52.745
-15.11
-22.27%
1 jan 1973 ano
56.359
+3.613
6.85%
1 jan 1974 ano
59.64
+3.281
5.82%
1 jan 1975 ano
56.31
-3.33
-5.58%
1 jan 1976 ano
62.867
+6.557
11.64%
1 jan 1977 ano
62.121
-0.746
-1.19%
1 jan 1978 ano
67.153
+5.032
8.1%
1 jan 1979 ano
70.006
+2.853
4.25%
1 jan 1980 ano
76.398
+6.392
9.13%
1 jan 1981 ano
76.388
-0.009
-0.01%
1 jan 1982 ano
77.047
+0.659
0.86%
1 jan 1983 ano
80.742
+3.695
4.8%
1 jan 1984 ano
82.309
+1.567
1.94%
1 jan 1985 ano
83.095
+0.786
0.95%
1 jan 1986 ano
87.458
+4.364
5.25%
1 jan 1987 ano
87.492
+0.034
0.04%
1 jan 1988 ano
88.167
+0.675
0.77%
1 jan 1989 ano
87.257
-0.91
-1.03%
1 jan 1990 ano
87.632
+0.375
0.43%
1 jan 1991 ano
88.323
+0.691
0.79%
1 jan 1992 ano
88.131
-0.192
-0.22%
1 jan 1993 ano
88.683
+0.552
0.63%
1 jan 1994 ano
87.914
-0.769
-0.87%
1 jan 1995 ano
88.145
+0.231
0.26%
1 jan 1996 ano
88.189
+0.045
0.05%
1 jan 1997 ano
87.87
-0.319
-0.36%
1 jan 1998 ano
82.97
-4.9
-5.58%
1 jan 1999 ano
85.148
+2.179
2.63%
1 jan 2000 ano
85.266
+0.118
0.14%
1 jan 2001 ano
84.613
-0.654
-0.77%
1 jan 2002 ano
84.193
-0.42
-0.5%
1 jan 2003 ano
83.273
-0.92
-1.09%
1 jan 2004 ano
81.849
-1.424
-1.71%
1 jan 2005 ano
83.554
+1.705
2.08%
1 jan 2006 ano
84.243
+0.688
0.82%
1 jan 2007 ano
80.417
-3.825
-4.54%
1 jan 2008 ano
82.778
+2.361
2.94%
1 jan 2009 ano
81.326
-1.452
-1.75%
Classificação de países por estatísticas atuais por anos


Comentários: