29
/pt/
pt
AIzaSyAYiBZKx7MnpbEhh9jyipgxe19OcubqV5w
April 1, 2024
139974
Ghana
GHA
true
2
1
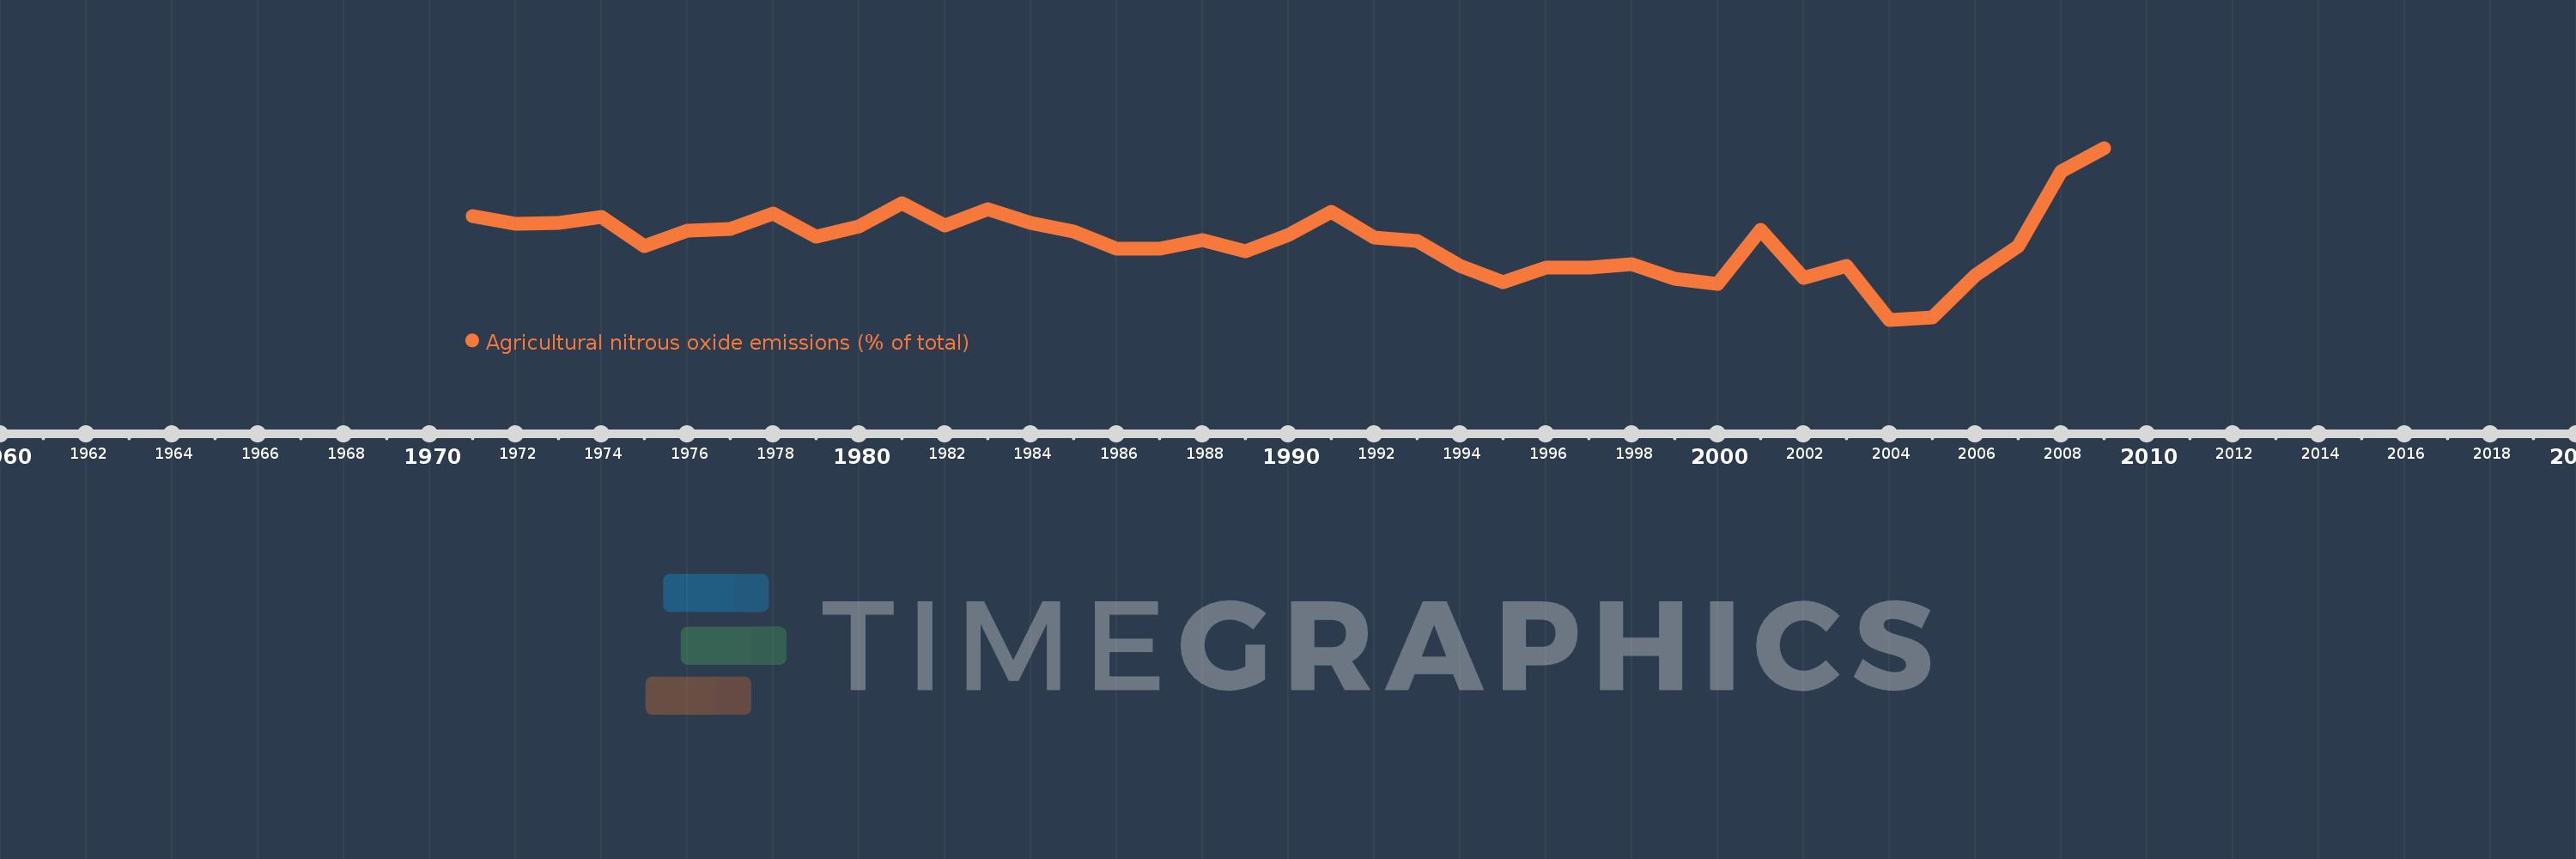
Agricultural nitrous oxide emissions (% of total)
2009,2008,2007,2006,2005,2004,2003,2002,2001,2000,1999,1998,1997,1996,1995,1994,1993,1992,1991,1990,1989,1988,1987,1986,1985,1984,1983,1982,1981,1980,1979,1978,1977,1976,1975,1974,1973,1972,1971
Estas estatísticas em outros países:
AfghanistanAlbaniaAlgeriaAmerican SamoaAndorraAngolaAntigua and BarbudaArab WorldArgentinaArmeniaArubaAustraliaAustriaAzerbaijanBahamas, TheBahrainBangladeshBarbadosBelarusBelgiumBelizeBeninBermudaBhutanBoliviaBosnia and HerzegovinaBotswanaBrazilBritish Virgin IslandsBrunei DarussalamBulgariaBurkina FasoBurundiCabo VerdeCambodiaCameroonCanadaCaribbean small statesCayman IslandsCentral African RepublicCentral Europe and the BalticsChadChileChinaColombiaComorosCongo, Dem. Rep.Congo, Rep.Costa RicaCote d'IvoireCroatiaCubaCyprusCzech RepublicDenmarkDjiboutiDominicaDominican RepublicEarly-demographic dividendEast Asia & PacificEast Asia & Pacific (excluding high income)East Asia & Pacific (IDA & IBRD countries)EcuadorEgypt, Arab Rep.El SalvadorEquatorial GuineaEritreaEstoniaEthiopiaEuro areaEurope & Central AsiaEurope & Central Asia (excluding high income)Europe & Central Asia (IDA & IBRD countries)European UnionFaroe IslandsFijiFinlandFragile and conflict affected situationsFranceFrench PolynesiaGabonGambia, TheGeorgiaGermanyGhanaGibraltarGreeceGreenlandGrenadaGuamGuatemalaGuineaGuinea-BissauGuyanaHaitiHeavily indebted poor countries (HIPC)High incomeHondurasHong Kong SAR, ChinaHungaryIBRD onlyIcelandIDA & IBRD totalIDA blendIDA onlyIDA totalIndiaIndonesiaIran, Islamic Rep.IraqIrelandIsraelItalyJamaicaJapanJordanKazakhstanKenyaKiribatiKorea, Dem. People’s Rep.Korea, Rep.KuwaitKyrgyz RepublicLao PDRLate-demographic dividendLatin America & Caribbean Latin America & Caribbean (excluding high income)Latin America & the Caribbean (IDA & IBRD countries)LatviaLeast developed countries: UN classificationLebanonLesothoLiberiaLibyaLithuaniaLow & middle incomeLow incomeLower middle incomeLuxembourgMacao SAR, ChinaMacedonia, FYRMadagascarMalawiMalaysiaMaldivesMaliMaltaMarshall IslandsMauritaniaMauritiusMexicoMicronesia, Fed. Sts.Middle East & North AfricaMiddle East & North Africa (excluding high income)Middle East & North Africa (IDA & IBRD countries)Middle incomeMoldovaMongoliaMoroccoMozambiqueMyanmarNamibiaNauruNepalNetherlandsNew CaledoniaNew ZealandNicaraguaNigerNigeriaNorth AmericaNorthern Mariana IslandsNorwayOECD membersOmanOther small statesPacific island small statesPakistanPalauPanamaPapua New GuineaParaguayPeruPhilippinesPolandPortugalPost-demographic dividendPre-demographic dividendPuerto RicoQatarRomaniaRussian FederationRwandaSamoaSao Tome and PrincipeSaudi ArabiaSenegalSerbiaSeychellesSierra LeoneSingaporeSlovak RepublicSloveniaSmall statesSolomon IslandsSomaliaSouth AfricaSouth AsiaSouth Asia (IDA & IBRD)SpainSri LankaSt. Kitts and NevisSt. LuciaSt. Vincent and the GrenadinesSub-Saharan Africa Sub-Saharan Africa (excluding high income)Sub-Saharan Africa (IDA & IBRD countries)SudanSurinameSwazilandSwedenSwitzerlandSyrian Arab RepublicTajikistanTanzaniaThailandTimor-LesteTogoTongaTrinidad and TobagoTunisiaTurkeyTurkmenistanTurks and Caicos IslandsTuvaluUgandaUkraineUnited Arab EmiratesUnited KingdomUnited StatesUpper middle incomeUruguayUzbekistanVanuatuVenezuela, RBVietnamVirgin Islands (U.S.)WorldYemen, Rep.ZambiaZimbabwe Linha do tempo:
Nesta escala de tempo está apresentado um gráfico de 1971 ano até 2009 ano Ghana. Dados de 1970 ano ausente. O número de observações reais por data: 39.
Fonte (nome):
Indicadores de desenvolvimento mundial
Fonte (organização):
World Bank staff estimates from original source: European Commission, Joint Research Centre (JRC)/Netherlands Environmental Assessment Agency (PBL). Emission Database for Global Atmospheric Research (EDGAR): http://edgar.jrc.ec.europa.eu/.
Categorias:
Agriculture & Rural Development, Environment
Foi atualizado:
23 abr 2017 ano
Indicadores de alterações dos valores ao longo dos anos
Mínimo:
66.846
1 jan 2004 ano
Máximo:
78.307
1 jan 2009 ano
Na data de observação
Valor
Mudança absoluta
A alteração em relação ao valor anterior
1 jan 1971 ano
73.758
+73.758
0.0%
1 jan 1972 ano
73.254
-0.505
-0.68%
1 jan 1973 ano
73.33
+0.077
0.1%
1 jan 1974 ano
73.695
+0.365
0.5%
1 jan 1975 ano
71.774
-1.921
-2.61%
1 jan 1976 ano
72.766
+0.991
1.38%
1 jan 1977 ano
72.917
+0.152
0.21%
1 jan 1978 ano
73.937
+1.02
1.4%
1 jan 1979 ano
72.416
-1.521
-2.06%
1 jan 1980 ano
73.091
+0.675
0.93%
1 jan 1981 ano
74.594
+1.503
2.06%
1 jan 1982 ano
73.148
-1.446
-1.94%
1 jan 1983 ano
74.207
+1.059
1.45%
1 jan 1984 ano
73.329
-0.878
-1.18%
1 jan 1985 ano
72.723
-0.606
-0.83%
1 jan 1986 ano
71.562
-1.161
-1.6%
1 jan 1987 ano
71.6
+0.038
0.05%
1 jan 1988 ano
72.149
+0.549
0.77%
1 jan 1989 ano
71.435
-0.714
-0.99%
1 jan 1990 ano
72.511
+1.076
1.51%
1 jan 1991 ano
74.026
+1.515
2.09%
1 jan 1992 ano
72.331
-1.695
-2.29%
1 jan 1993 ano
72.099
-0.232
-0.32%
1 jan 1994 ano
70.425
-1.674
-2.32%
1 jan 1995 ano
69.35
-1.075
-1.53%
1 jan 1996 ano
70.327
+0.978
1.41%
1 jan 1997 ano
70.326
-0.002
0.0%
1 jan 1998 ano
70.548
+0.222
0.32%
1 jan 1999 ano
69.598
-0.95
-1.35%
1 jan 2000 ano
69.256
-0.342
-0.49%
1 jan 2001 ano
72.862
+3.606
5.21%
1 jan 2002 ano
69.629
-3.233
-4.44%
1 jan 2003 ano
70.447
+0.818
1.17%
1 jan 2004 ano
66.846
-3.601
-5.11%
1 jan 2005 ano
67.017
+0.171
0.26%
1 jan 2006 ano
69.798
+2.781
4.15%
1 jan 2007 ano
71.755
+1.957
2.8%
1 jan 2008 ano
76.731
+4.975
6.93%
1 jan 2009 ano
78.307
+1.577
2.05%
Classificação de países por estatísticas atuais por anos


Comentários: