29
/pt/
pt
AIzaSyAYiBZKx7MnpbEhh9jyipgxe19OcubqV5w
April 1, 2024
129060
Estonia
EST
true
2
1
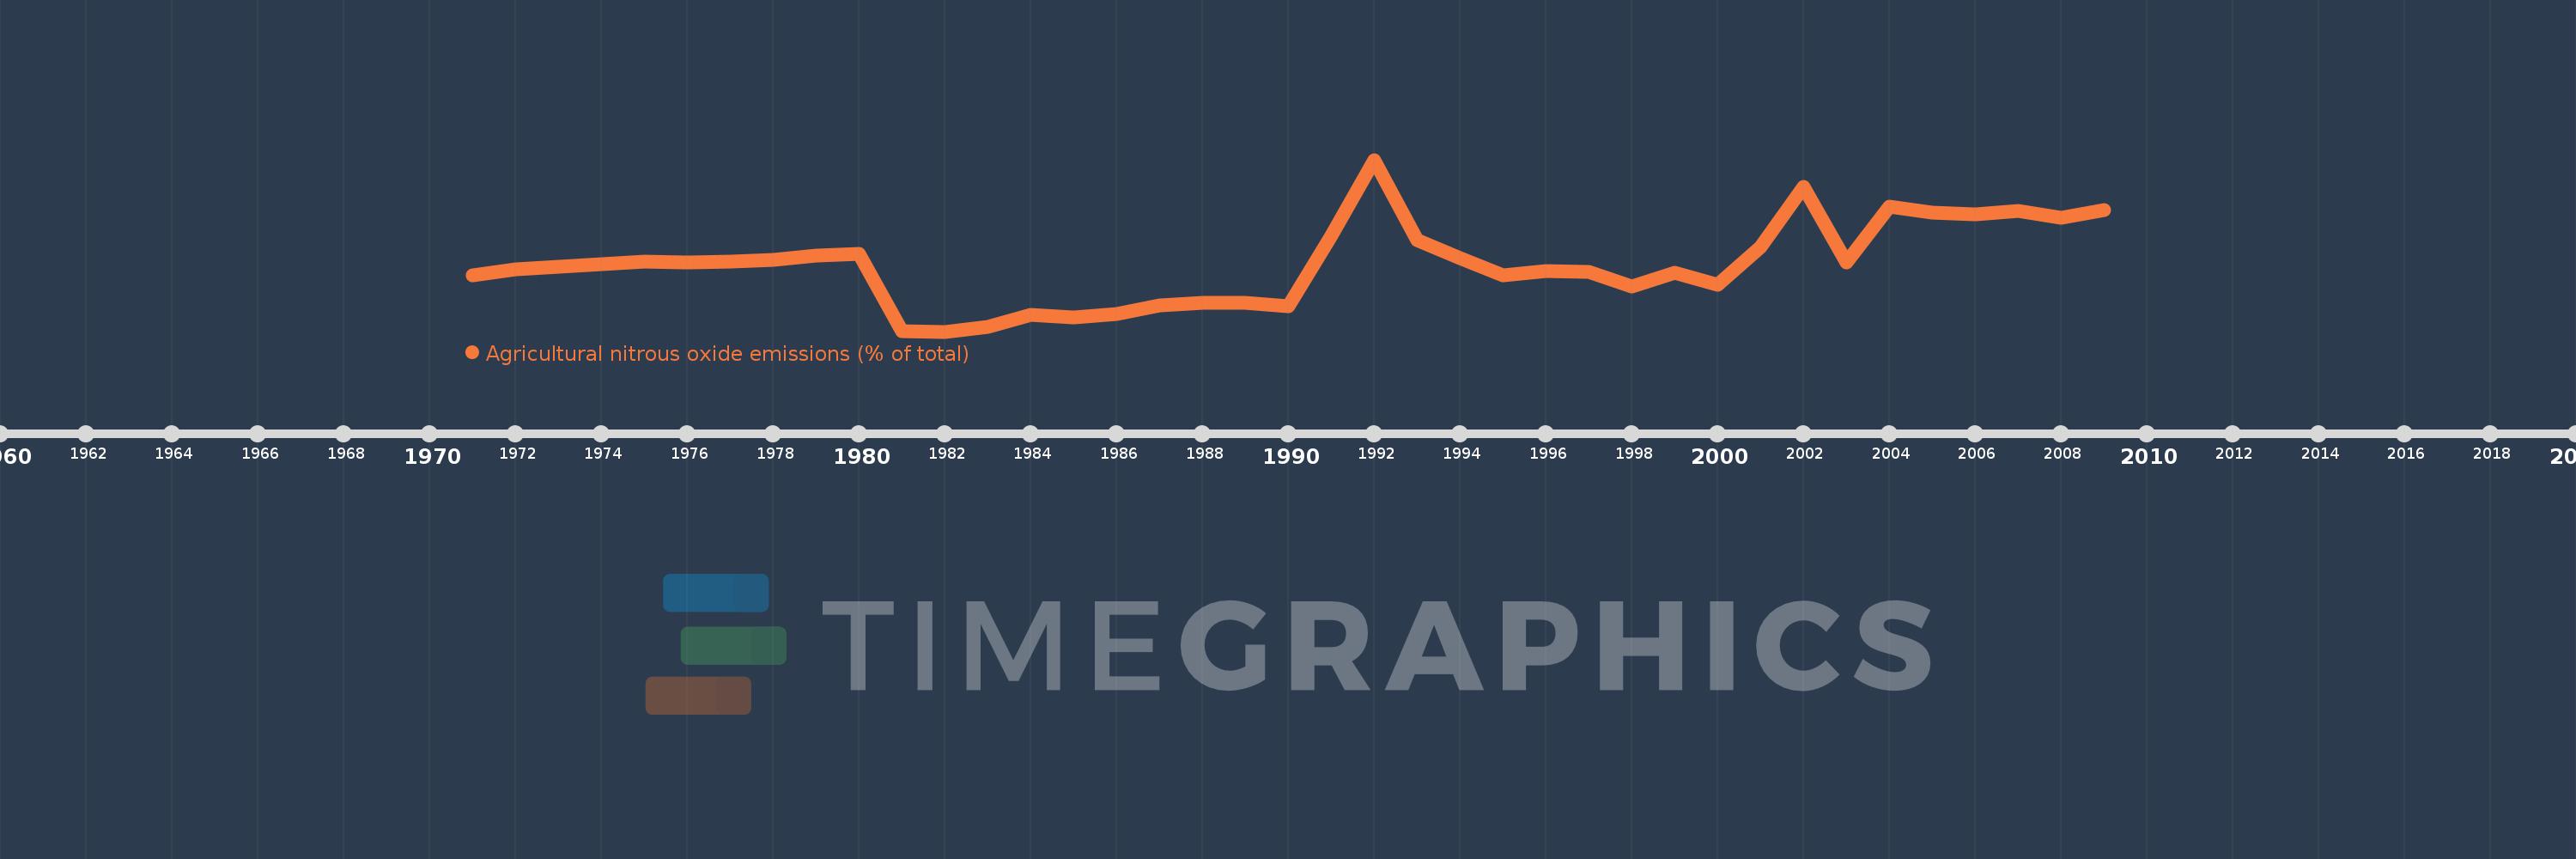
Agricultural nitrous oxide emissions (% of total)
2009,2008,2007,2006,2005,2004,2003,2002,2001,2000,1999,1998,1997,1996,1995,1994,1993,1992,1991,1990,1989,1988,1987,1986,1985,1984,1983,1982,1981,1980,1979,1978,1977,1976,1975,1974,1973,1972,1971
Estas estatísticas em outros países:
AfghanistanAlbaniaAlgeriaAmerican SamoaAndorraAngolaAntigua and BarbudaArab WorldArgentinaArmeniaArubaAustraliaAustriaAzerbaijanBahamas, TheBahrainBangladeshBarbadosBelarusBelgiumBelizeBeninBermudaBhutanBoliviaBosnia and HerzegovinaBotswanaBrazilBritish Virgin IslandsBrunei DarussalamBulgariaBurkina FasoBurundiCabo VerdeCambodiaCameroonCanadaCaribbean small statesCayman IslandsCentral African RepublicCentral Europe and the BalticsChadChileChinaColombiaComorosCongo, Dem. Rep.Congo, Rep.Costa RicaCote d'IvoireCroatiaCubaCyprusCzech RepublicDenmarkDjiboutiDominicaDominican RepublicEarly-demographic dividendEast Asia & PacificEast Asia & Pacific (excluding high income)East Asia & Pacific (IDA & IBRD countries)EcuadorEgypt, Arab Rep.El SalvadorEquatorial GuineaEritreaEstoniaEthiopiaEuro areaEurope & Central AsiaEurope & Central Asia (excluding high income)Europe & Central Asia (IDA & IBRD countries)European UnionFaroe IslandsFijiFinlandFragile and conflict affected situationsFranceFrench PolynesiaGabonGambia, TheGeorgiaGermanyGhanaGibraltarGreeceGreenlandGrenadaGuamGuatemalaGuineaGuinea-BissauGuyanaHaitiHeavily indebted poor countries (HIPC)High incomeHondurasHong Kong SAR, ChinaHungaryIBRD onlyIcelandIDA & IBRD totalIDA blendIDA onlyIDA totalIndiaIndonesiaIran, Islamic Rep.IraqIrelandIsraelItalyJamaicaJapanJordanKazakhstanKenyaKiribatiKorea, Dem. People’s Rep.Korea, Rep.KuwaitKyrgyz RepublicLao PDRLate-demographic dividendLatin America & Caribbean Latin America & Caribbean (excluding high income)Latin America & the Caribbean (IDA & IBRD countries)LatviaLeast developed countries: UN classificationLebanonLesothoLiberiaLibyaLithuaniaLow & middle incomeLow incomeLower middle incomeLuxembourgMacao SAR, ChinaMacedonia, FYRMadagascarMalawiMalaysiaMaldivesMaliMaltaMarshall IslandsMauritaniaMauritiusMexicoMicronesia, Fed. Sts.Middle East & North AfricaMiddle East & North Africa (excluding high income)Middle East & North Africa (IDA & IBRD countries)Middle incomeMoldovaMongoliaMoroccoMozambiqueMyanmarNamibiaNauruNepalNetherlandsNew CaledoniaNew ZealandNicaraguaNigerNigeriaNorth AmericaNorthern Mariana IslandsNorwayOECD membersOmanOther small statesPacific island small statesPakistanPalauPanamaPapua New GuineaParaguayPeruPhilippinesPolandPortugalPost-demographic dividendPre-demographic dividendPuerto RicoQatarRomaniaRussian FederationRwandaSamoaSao Tome and PrincipeSaudi ArabiaSenegalSerbiaSeychellesSierra LeoneSingaporeSlovak RepublicSloveniaSmall statesSolomon IslandsSomaliaSouth AfricaSouth AsiaSouth Asia (IDA & IBRD)SpainSri LankaSt. Kitts and NevisSt. LuciaSt. Vincent and the GrenadinesSub-Saharan Africa Sub-Saharan Africa (excluding high income)Sub-Saharan Africa (IDA & IBRD countries)SudanSurinameSwazilandSwedenSwitzerlandSyrian Arab RepublicTajikistanTanzaniaThailandTimor-LesteTogoTongaTrinidad and TobagoTunisiaTurkeyTurkmenistanTurks and Caicos IslandsTuvaluUgandaUkraineUnited Arab EmiratesUnited KingdomUnited StatesUpper middle incomeUruguayUzbekistanVanuatuVenezuela, RBVietnamVirgin Islands (U.S.)WorldYemen, Rep.ZambiaZimbabwe Linha do tempo:
Nesta escala de tempo está apresentado um gráfico de 1971 ano até 2009 ano Estonia. Dados de 1970 ano ausente. O número de observações reais por data: 39.
Fonte (nome):
Indicadores de desenvolvimento mundial
Fonte (organização):
World Bank staff estimates from original source: European Commission, Joint Research Centre (JRC)/Netherlands Environmental Assessment Agency (PBL). Emission Database for Global Atmospheric Research (EDGAR): http://edgar.jrc.ec.europa.eu/.
Categorias:
Agriculture & Rural Development, Environment
Foi atualizado:
23 abr 2017 ano
Indicadores de alterações dos valores ao longo dos anos
Mínimo:
41.238
1 jan 1982 ano
Máximo:
75.219
1 jan 1992 ano
Na data de observação
Valor
Mudança absoluta
A alteração em relação ao valor anterior
1 jan 1971 ano
52.35
+52.35
0.0%
1 jan 1972 ano
53.593
+1.243
2.37%
1 jan 1973 ano
54.142
+0.549
1.02%
1 jan 1974 ano
54.546
+0.404
0.75%
1 jan 1975 ano
55.152
+0.606
1.11%
1 jan 1976 ano
54.885
-0.267
-0.48%
1 jan 1977 ano
55.016
+0.131
0.24%
1 jan 1978 ano
55.361
+0.346
0.63%
1 jan 1979 ano
56.246
+0.884
1.6%
1 jan 1980 ano
56.575
+0.33
0.59%
1 jan 1981 ano
41.262
-15.313
-27.07%
1 jan 1982 ano
41.238
-0.024
-0.06%
1 jan 1983 ano
42.141
+0.903
2.19%
1 jan 1984 ano
44.562
+2.42
5.74%
1 jan 1985 ano
44.075
-0.487
-1.09%
1 jan 1986 ano
44.763
+0.688
1.56%
1 jan 1987 ano
46.342
+1.579
3.53%
1 jan 1988 ano
46.937
+0.594
1.28%
1 jan 1989 ano
46.973
+0.037
0.08%
1 jan 1990 ano
46.261
-0.712
-1.52%
1 jan 1991 ano
60.236
+13.975
30.21%
1 jan 1992 ano
75.219
+14.983
24.87%
1 jan 1993 ano
59.275
-15.944
-21.2%
1 jan 1994 ano
55.713
-3.562
-6.01%
1 jan 1995 ano
52.407
-3.306
-5.93%
1 jan 1996 ano
53.295
+0.888
1.69%
1 jan 1997 ano
52.993
-0.302
-0.57%
1 jan 1998 ano
50.191
-2.802
-5.29%
1 jan 1999 ano
52.902
+2.711
5.4%
1 jan 2000 ano
50.495
-2.407
-4.55%
1 jan 2001 ano
57.965
+7.47
14.79%
1 jan 2002 ano
69.888
+11.924
20.57%
1 jan 2003 ano
54.896
-14.993
-21.45%
1 jan 2004 ano
65.886
+10.99
20.02%
1 jan 2005 ano
64.735
-1.151
-1.75%
1 jan 2006 ano
64.493
-0.241
-0.37%
1 jan 2007 ano
65.158
+0.665
1.03%
1 jan 2008 ano
63.761
-1.397
-2.14%
1 jan 2009 ano
65.288
+1.527
2.39%
Classificação de países por estatísticas atuais por anos


Comentários: