29
/pt/
pt
AIzaSyAYiBZKx7MnpbEhh9jyipgxe19OcubqV5w
April 1, 2024
106845
Colombia
COL
true
2
1
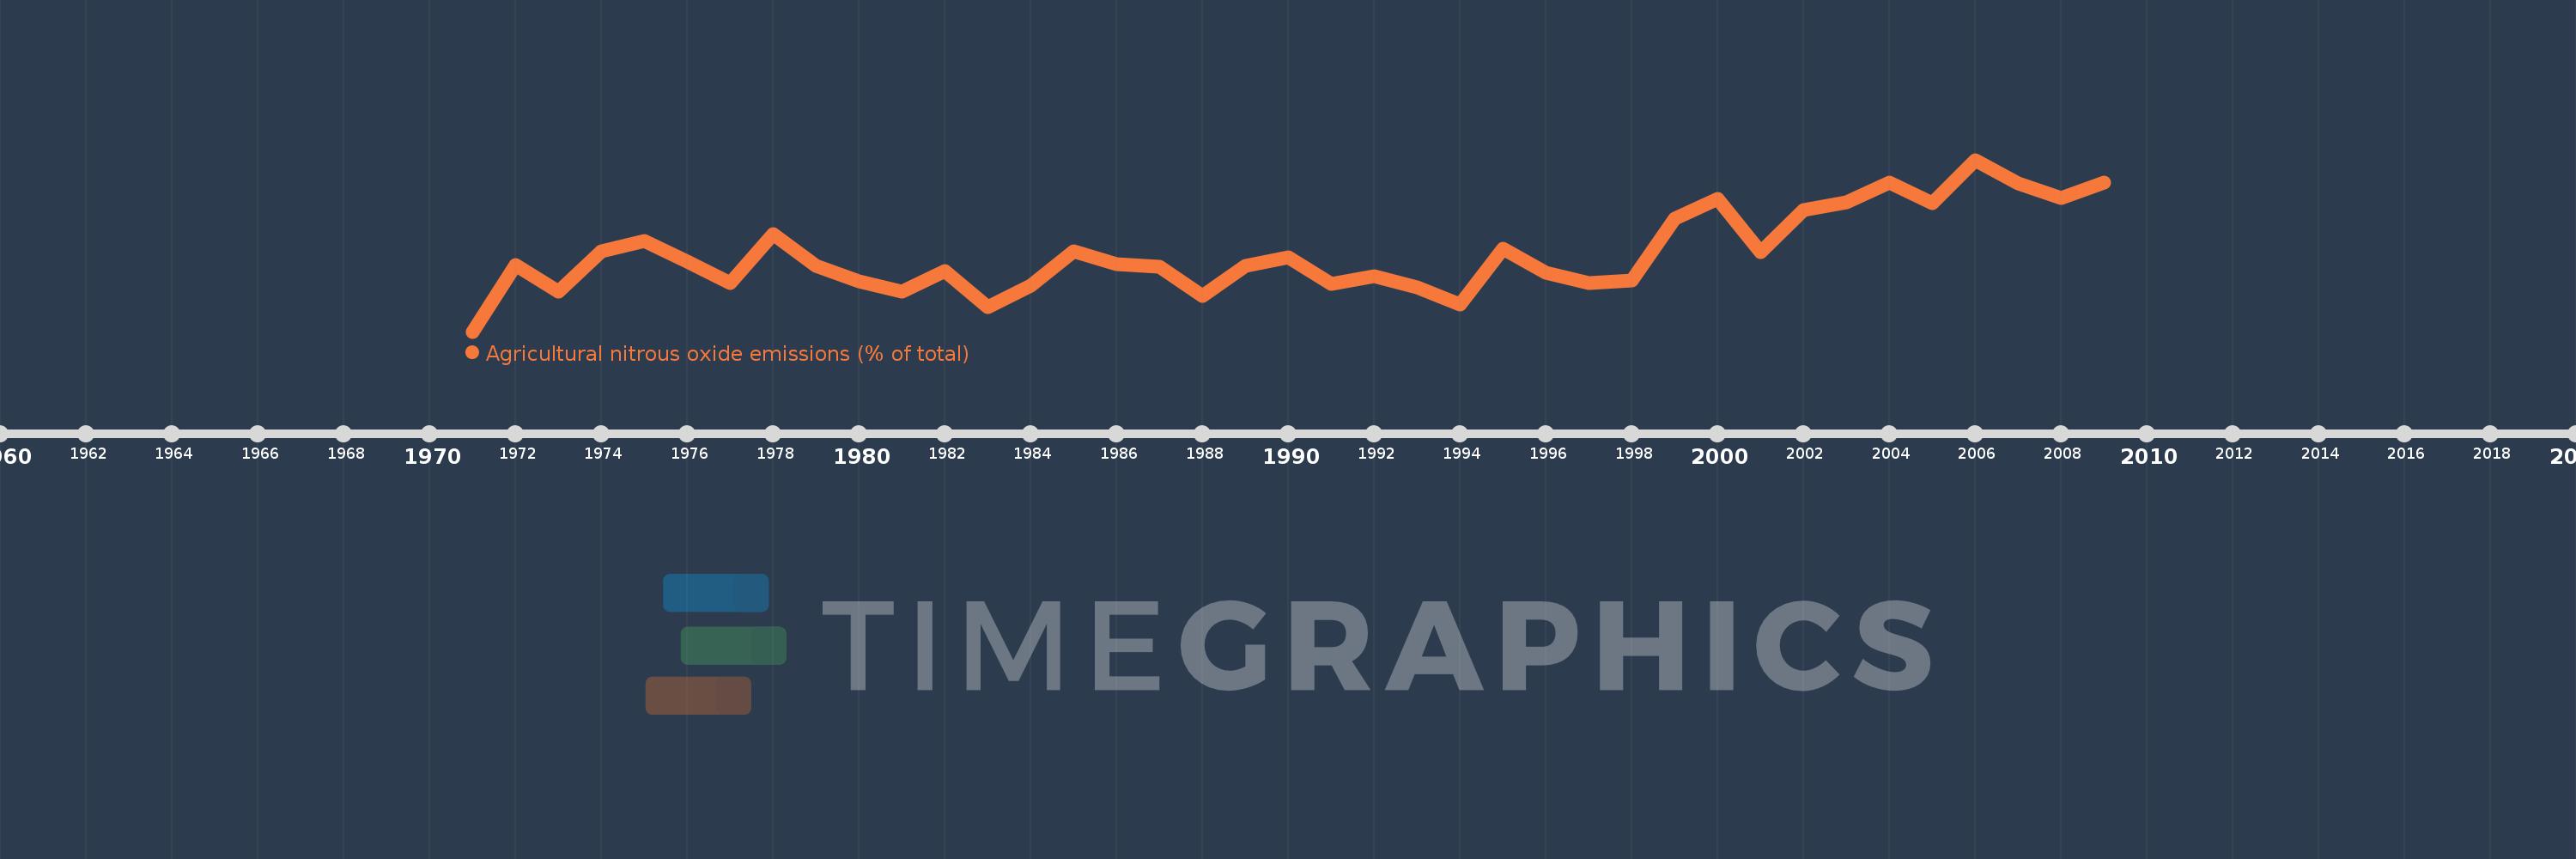
Agricultural nitrous oxide emissions (% of total)
2009,2008,2007,2006,2005,2004,2003,2002,2001,2000,1999,1998,1997,1996,1995,1994,1993,1992,1991,1990,1989,1988,1987,1986,1985,1984,1983,1982,1981,1980,1979,1978,1977,1976,1975,1974,1973,1972,1971
Estas estatísticas em outros países:
AfghanistanAlbaniaAlgeriaAmerican SamoaAndorraAngolaAntigua and BarbudaArab WorldArgentinaArmeniaArubaAustraliaAustriaAzerbaijanBahamas, TheBahrainBangladeshBarbadosBelarusBelgiumBelizeBeninBermudaBhutanBoliviaBosnia and HerzegovinaBotswanaBrazilBritish Virgin IslandsBrunei DarussalamBulgariaBurkina FasoBurundiCabo VerdeCambodiaCameroonCanadaCaribbean small statesCayman IslandsCentral African RepublicCentral Europe and the BalticsChadChileChinaColombiaComorosCongo, Dem. Rep.Congo, Rep.Costa RicaCote d'IvoireCroatiaCubaCyprusCzech RepublicDenmarkDjiboutiDominicaDominican RepublicEarly-demographic dividendEast Asia & PacificEast Asia & Pacific (excluding high income)East Asia & Pacific (IDA & IBRD countries)EcuadorEgypt, Arab Rep.El SalvadorEquatorial GuineaEritreaEstoniaEthiopiaEuro areaEurope & Central AsiaEurope & Central Asia (excluding high income)Europe & Central Asia (IDA & IBRD countries)European UnionFaroe IslandsFijiFinlandFragile and conflict affected situationsFranceFrench PolynesiaGabonGambia, TheGeorgiaGermanyGhanaGibraltarGreeceGreenlandGrenadaGuamGuatemalaGuineaGuinea-BissauGuyanaHaitiHeavily indebted poor countries (HIPC)High incomeHondurasHong Kong SAR, ChinaHungaryIBRD onlyIcelandIDA & IBRD totalIDA blendIDA onlyIDA totalIndiaIndonesiaIran, Islamic Rep.IraqIrelandIsraelItalyJamaicaJapanJordanKazakhstanKenyaKiribatiKorea, Dem. People’s Rep.Korea, Rep.KuwaitKyrgyz RepublicLao PDRLate-demographic dividendLatin America & Caribbean Latin America & Caribbean (excluding high income)Latin America & the Caribbean (IDA & IBRD countries)LatviaLeast developed countries: UN classificationLebanonLesothoLiberiaLibyaLithuaniaLow & middle incomeLow incomeLower middle incomeLuxembourgMacao SAR, ChinaMacedonia, FYRMadagascarMalawiMalaysiaMaldivesMaliMaltaMarshall IslandsMauritaniaMauritiusMexicoMicronesia, Fed. Sts.Middle East & North AfricaMiddle East & North Africa (excluding high income)Middle East & North Africa (IDA & IBRD countries)Middle incomeMoldovaMongoliaMoroccoMozambiqueMyanmarNamibiaNauruNepalNetherlandsNew CaledoniaNew ZealandNicaraguaNigerNigeriaNorth AmericaNorthern Mariana IslandsNorwayOECD membersOmanOther small statesPacific island small statesPakistanPalauPanamaPapua New GuineaParaguayPeruPhilippinesPolandPortugalPost-demographic dividendPre-demographic dividendPuerto RicoQatarRomaniaRussian FederationRwandaSamoaSao Tome and PrincipeSaudi ArabiaSenegalSerbiaSeychellesSierra LeoneSingaporeSlovak RepublicSloveniaSmall statesSolomon IslandsSomaliaSouth AfricaSouth AsiaSouth Asia (IDA & IBRD)SpainSri LankaSt. Kitts and NevisSt. LuciaSt. Vincent and the GrenadinesSub-Saharan Africa Sub-Saharan Africa (excluding high income)Sub-Saharan Africa (IDA & IBRD countries)SudanSurinameSwazilandSwedenSwitzerlandSyrian Arab RepublicTajikistanTanzaniaThailandTimor-LesteTogoTongaTrinidad and TobagoTunisiaTurkeyTurkmenistanTurks and Caicos IslandsTuvaluUgandaUkraineUnited Arab EmiratesUnited KingdomUnited StatesUpper middle incomeUruguayUzbekistanVanuatuVenezuela, RBVietnamVirgin Islands (U.S.)WorldYemen, Rep.ZambiaZimbabwe Linha do tempo:
Nesta escala de tempo está apresentado um gráfico de 1971 ano até 2009 ano Colombia. Dados de 1970 ano ausente. O número de observações reais por data: 39.
Fonte (nome):
Indicadores de desenvolvimento mundial
Fonte (organização):
World Bank staff estimates from original source: European Commission, Joint Research Centre (JRC)/Netherlands Environmental Assessment Agency (PBL). Emission Database for Global Atmospheric Research (EDGAR): http://edgar.jrc.ec.europa.eu/.
Categorias:
Agriculture & Rural Development, Environment
Foi atualizado:
23 abr 2017 ano
Indicadores de alterações dos valores ao longo dos anos
Mínimo:
77.764
1 jan 1971 ano
Máximo:
85.961
1 jan 2006 ano
Na data de observação
Valor
Mudança absoluta
A alteração em relação ao valor anterior
1 jan 1971 ano
77.764
+77.764
0.0%
1 jan 1972 ano
80.957
+3.192
4.1%
1 jan 1973 ano
79.67
-1.286
-1.59%
1 jan 1974 ano
81.585
+1.915
2.4%
1 jan 1975 ano
82.068
+0.483
0.59%
1 jan 1976 ano
81.122
-0.947
-1.15%
1 jan 1977 ano
80.089
-1.032
-1.27%
1 jan 1978 ano
82.398
+2.308
2.88%
1 jan 1979 ano
80.889
-1.509
-1.83%
1 jan 1980 ano
80.168
-0.721
-0.89%
1 jan 1981 ano
79.651
-0.517
-0.65%
1 jan 1982 ano
80.66
+1.009
1.27%
1 jan 1983 ano
78.948
-1.711
-2.12%
1 jan 1984 ano
79.957
+1.009
1.28%
1 jan 1985 ano
81.607
+1.65
2.06%
1 jan 1986 ano
80.966
-0.642
-0.79%
1 jan 1987 ano
80.841
-0.125
-0.15%
1 jan 1988 ano
79.451
-1.39
-1.72%
1 jan 1989 ano
80.914
+1.463
1.84%
1 jan 1990 ano
81.295
+0.381
0.47%
1 jan 1991 ano
80.057
-1.238
-1.52%
1 jan 1992 ano
80.419
+0.362
0.45%
1 jan 1993 ano
79.886
-0.533
-0.66%
1 jan 1994 ano
79.039
-0.847
-1.06%
1 jan 1995 ano
81.699
+2.66
3.37%
1 jan 1996 ano
80.553
-1.147
-1.4%
1 jan 1997 ano
80.062
-0.491
-0.61%
1 jan 1998 ano
80.22
+0.158
0.2%
1 jan 1999 ano
83.137
+2.918
3.64%
1 jan 2000 ano
84.089
+0.951
1.14%
1 jan 2001 ano
81.541
-2.547
-3.03%
1 jan 2002 ano
83.582
+2.041
2.5%
1 jan 2003 ano
83.932
+0.35
0.42%
1 jan 2004 ano
84.869
+0.937
1.12%
1 jan 2005 ano
83.881
-0.988
-1.16%
1 jan 2006 ano
85.961
+2.08
2.48%
1 jan 2007 ano
84.824
-1.137
-1.32%
1 jan 2008 ano
84.129
-0.695
-0.82%
1 jan 2009 ano
84.875
+0.746
0.89%
Classificação de países por estatísticas atuais por anos


Comentários: