29
/pt/
pt
AIzaSyAYiBZKx7MnpbEhh9jyipgxe19OcubqV5w
April 1, 2024
100829
Canada
CAN
true
2
1
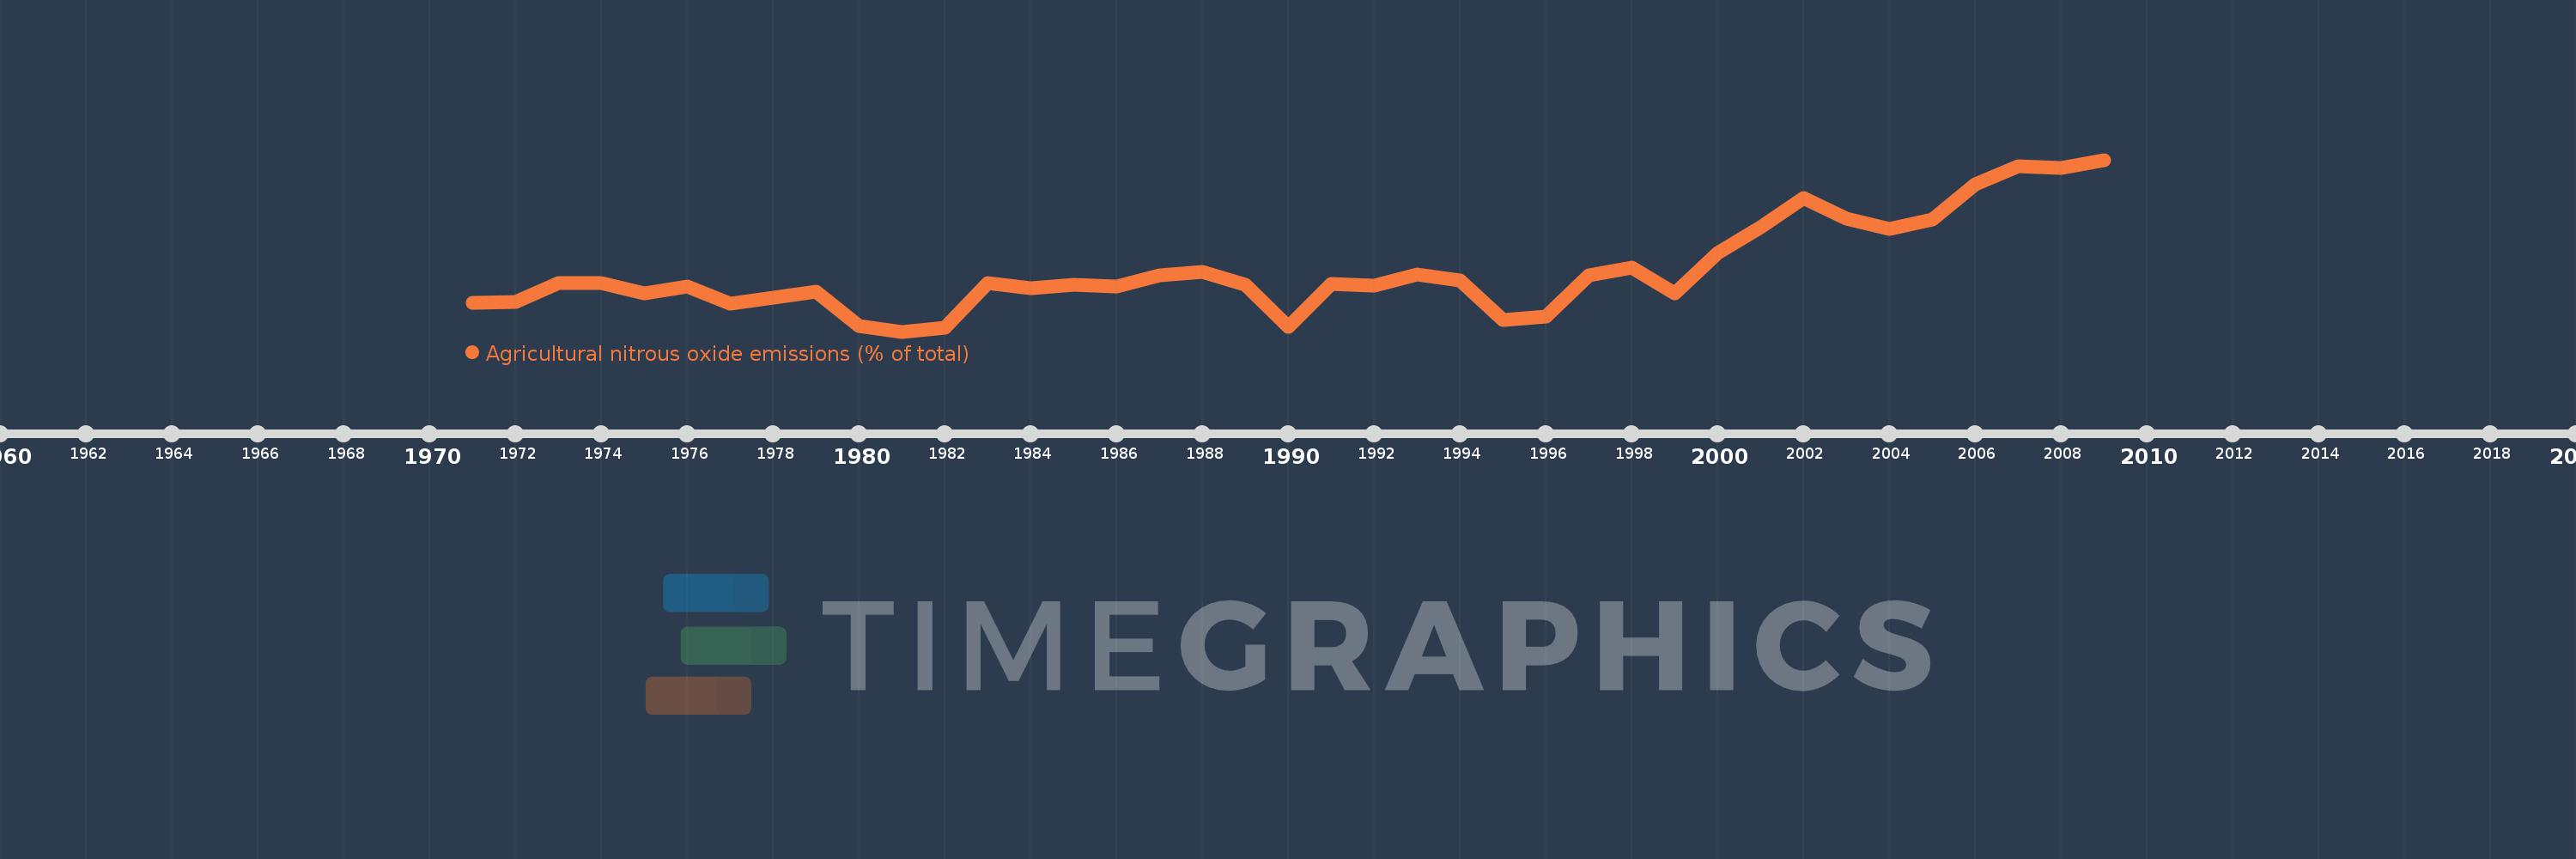
Agricultural nitrous oxide emissions (% of total)
2009,2008,2007,2006,2005,2004,2003,2002,2001,2000,1999,1998,1997,1996,1995,1994,1993,1992,1991,1990,1989,1988,1987,1986,1985,1984,1983,1982,1981,1980,1979,1978,1977,1976,1975,1974,1973,1972,1971
Estas estatísticas em outros países:
AfghanistanAlbaniaAlgeriaAmerican SamoaAndorraAngolaAntigua and BarbudaArab WorldArgentinaArmeniaArubaAustraliaAustriaAzerbaijanBahamas, TheBahrainBangladeshBarbadosBelarusBelgiumBelizeBeninBermudaBhutanBoliviaBosnia and HerzegovinaBotswanaBrazilBritish Virgin IslandsBrunei DarussalamBulgariaBurkina FasoBurundiCabo VerdeCambodiaCameroonCanadaCaribbean small statesCayman IslandsCentral African RepublicCentral Europe and the BalticsChadChileChinaColombiaComorosCongo, Dem. Rep.Congo, Rep.Costa RicaCote d'IvoireCroatiaCubaCyprusCzech RepublicDenmarkDjiboutiDominicaDominican RepublicEarly-demographic dividendEast Asia & PacificEast Asia & Pacific (excluding high income)East Asia & Pacific (IDA & IBRD countries)EcuadorEgypt, Arab Rep.El SalvadorEquatorial GuineaEritreaEstoniaEthiopiaEuro areaEurope & Central AsiaEurope & Central Asia (excluding high income)Europe & Central Asia (IDA & IBRD countries)European UnionFaroe IslandsFijiFinlandFragile and conflict affected situationsFranceFrench PolynesiaGabonGambia, TheGeorgiaGermanyGhanaGibraltarGreeceGreenlandGrenadaGuamGuatemalaGuineaGuinea-BissauGuyanaHaitiHeavily indebted poor countries (HIPC)High incomeHondurasHong Kong SAR, ChinaHungaryIBRD onlyIcelandIDA & IBRD totalIDA blendIDA onlyIDA totalIndiaIndonesiaIran, Islamic Rep.IraqIrelandIsraelItalyJamaicaJapanJordanKazakhstanKenyaKiribatiKorea, Dem. People’s Rep.Korea, Rep.KuwaitKyrgyz RepublicLao PDRLate-demographic dividendLatin America & Caribbean Latin America & Caribbean (excluding high income)Latin America & the Caribbean (IDA & IBRD countries)LatviaLeast developed countries: UN classificationLebanonLesothoLiberiaLibyaLithuaniaLow & middle incomeLow incomeLower middle incomeLuxembourgMacao SAR, ChinaMacedonia, FYRMadagascarMalawiMalaysiaMaldivesMaliMaltaMarshall IslandsMauritaniaMauritiusMexicoMicronesia, Fed. Sts.Middle East & North AfricaMiddle East & North Africa (excluding high income)Middle East & North Africa (IDA & IBRD countries)Middle incomeMoldovaMongoliaMoroccoMozambiqueMyanmarNamibiaNauruNepalNetherlandsNew CaledoniaNew ZealandNicaraguaNigerNigeriaNorth AmericaNorthern Mariana IslandsNorwayOECD membersOmanOther small statesPacific island small statesPakistanPalauPanamaPapua New GuineaParaguayPeruPhilippinesPolandPortugalPost-demographic dividendPre-demographic dividendPuerto RicoQatarRomaniaRussian FederationRwandaSamoaSao Tome and PrincipeSaudi ArabiaSenegalSerbiaSeychellesSierra LeoneSingaporeSlovak RepublicSloveniaSmall statesSolomon IslandsSomaliaSouth AfricaSouth AsiaSouth Asia (IDA & IBRD)SpainSri LankaSt. Kitts and NevisSt. LuciaSt. Vincent and the GrenadinesSub-Saharan Africa Sub-Saharan Africa (excluding high income)Sub-Saharan Africa (IDA & IBRD countries)SudanSurinameSwazilandSwedenSwitzerlandSyrian Arab RepublicTajikistanTanzaniaThailandTimor-LesteTogoTongaTrinidad and TobagoTunisiaTurkeyTurkmenistanTurks and Caicos IslandsTuvaluUgandaUkraineUnited Arab EmiratesUnited KingdomUnited StatesUpper middle incomeUruguayUzbekistanVanuatuVenezuela, RBVietnamVirgin Islands (U.S.)WorldYemen, Rep.ZambiaZimbabwe Linha do tempo:
Nesta escala de tempo está apresentado um gráfico de 1971 ano até 2009 ano Canada. Dados de 1970 ano ausente. O número de observações reais por data: 39.
Fonte (nome):
Indicadores de desenvolvimento mundial
Fonte (organização):
World Bank staff estimates from original source: European Commission, Joint Research Centre (JRC)/Netherlands Environmental Assessment Agency (PBL). Emission Database for Global Atmospheric Research (EDGAR): http://edgar.jrc.ec.europa.eu/.
Categorias:
Agriculture & Rural Development, Environment
Foi atualizado:
23 abr 2017 ano
Indicadores de alterações dos valores ao longo dos anos
Mínimo:
25.929
1 jan 1981 ano
Máximo:
65.432
1 jan 2009 ano
Na data de observação
Valor
Mudança absoluta
A alteração em relação ao valor anterior
1 jan 1971 ano
32.585
+32.585
0.0%
1 jan 1972 ano
32.748
+0.163
0.5%
1 jan 1973 ano
37.156
+4.408
13.46%
1 jan 1974 ano
36.995
-0.161
-0.43%
1 jan 1975 ano
34.737
-2.259
-6.11%
1 jan 1976 ano
36.386
+1.649
4.75%
1 jan 1977 ano
32.377
-4.008
-11.02%
1 jan 1978 ano
33.686
+1.309
4.04%
1 jan 1979 ano
35.188
+1.502
4.46%
1 jan 1980 ano
27.156
-8.032
-22.83%
1 jan 1981 ano
25.929
-1.227
-4.52%
1 jan 1982 ano
26.836
+0.906
3.5%
1 jan 1983 ano
37.081
+10.246
38.18%
1 jan 1984 ano
35.9
-1.181
-3.18%
1 jan 1985 ano
36.756
+0.855
2.38%
1 jan 1986 ano
36.323
-0.432
-1.18%
1 jan 1987 ano
38.842
+2.519
6.94%
1 jan 1988 ano
39.664
+0.821
2.11%
1 jan 1989 ano
36.678
-2.985
-7.53%
1 jan 1990 ano
27.025
-9.653
-26.32%
1 jan 1991 ano
36.895
+9.87
36.52%
1 jan 1992 ano
36.571
-0.324
-0.88%
1 jan 1993 ano
39.012
+2.441
6.68%
1 jan 1994 ano
37.713
-1.3
-3.33%
1 jan 1995 ano
28.58
-9.133
-24.22%
1 jan 1996 ano
29.343
+0.763
2.67%
1 jan 1997 ano
38.881
+9.538
32.51%
1 jan 1998 ano
40.635
+1.755
4.51%
1 jan 1999 ano
34.643
-5.992
-14.75%
1 jan 2000 ano
44.076
+9.434
27.23%
1 jan 2001 ano
50.013
+5.936
13.47%
1 jan 2002 ano
56.731
+6.718
13.43%
1 jan 2003 ano
51.941
-4.79
-8.44%
1 jan 2004 ano
49.588
-2.353
-4.53%
1 jan 2005 ano
51.619
+2.031
4.1%
1 jan 2006 ano
59.884
+8.264
16.01%
1 jan 2007 ano
63.958
+4.075
6.8%
1 jan 2008 ano
63.521
-0.437
-0.68%
1 jan 2009 ano
65.432
+1.911
3.01%
Classificação de países por estatísticas atuais por anos


Comentários: