29
/pt/
pt
AIzaSyAYiBZKx7MnpbEhh9jyipgxe19OcubqV5w
April 1, 2024
101731
Cayman Islands
CYM
true
2
1
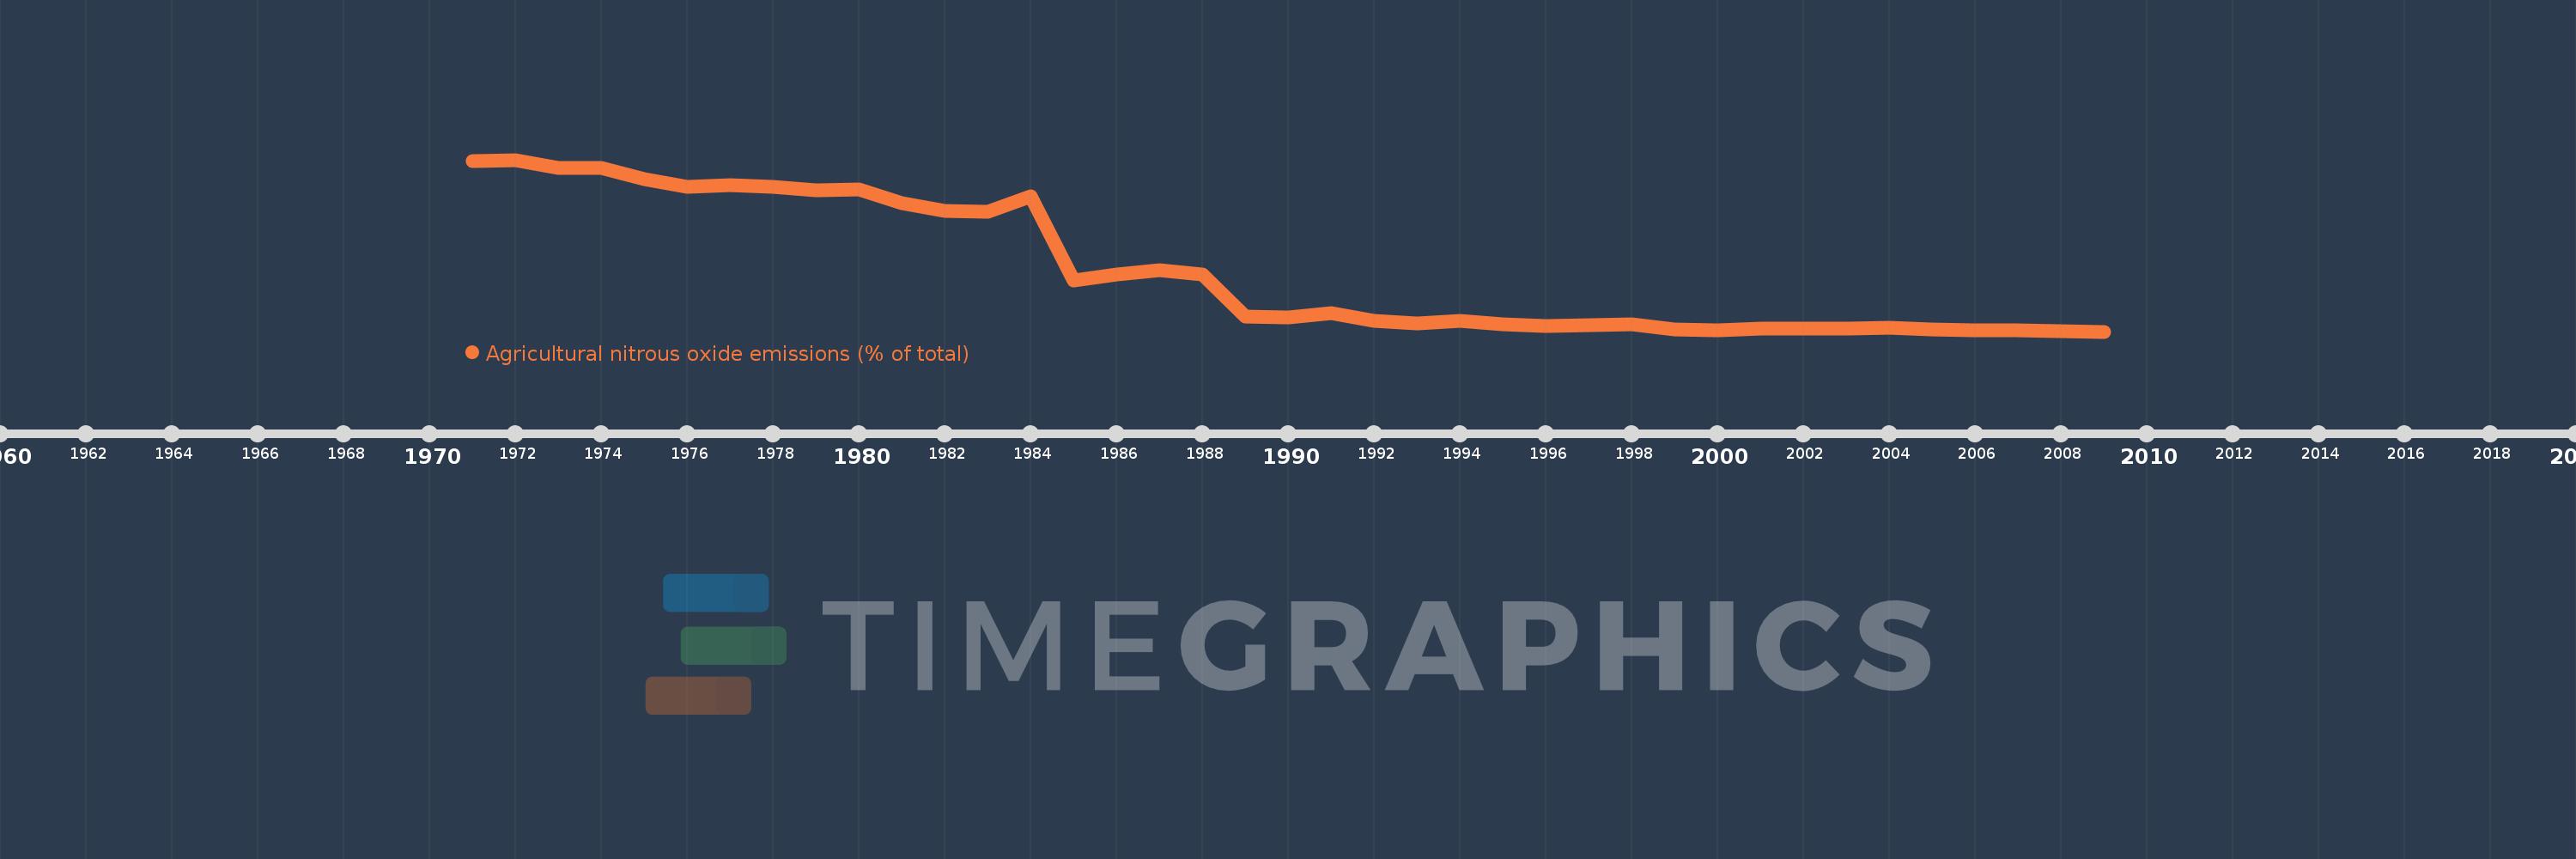
Agricultural nitrous oxide emissions (% of total)
2009,2008,2007,2006,2005,2004,2003,2002,2001,2000,1999,1998,1997,1996,1995,1994,1993,1992,1991,1990,1989,1988,1987,1986,1985,1984,1983,1982,1981,1980,1979,1978,1977,1976,1975,1974,1973,1972,1971
Estas estatísticas em outros países:
AfghanistanAlbaniaAlgeriaAmerican SamoaAndorraAngolaAntigua and BarbudaArab WorldArgentinaArmeniaArubaAustraliaAustriaAzerbaijanBahamas, TheBahrainBangladeshBarbadosBelarusBelgiumBelizeBeninBermudaBhutanBoliviaBosnia and HerzegovinaBotswanaBrazilBritish Virgin IslandsBrunei DarussalamBulgariaBurkina FasoBurundiCabo VerdeCambodiaCameroonCanadaCaribbean small statesCayman IslandsCentral African RepublicCentral Europe and the BalticsChadChileChinaColombiaComorosCongo, Dem. Rep.Congo, Rep.Costa RicaCote d'IvoireCroatiaCubaCyprusCzech RepublicDenmarkDjiboutiDominicaDominican RepublicEarly-demographic dividendEast Asia & PacificEast Asia & Pacific (excluding high income)East Asia & Pacific (IDA & IBRD countries)EcuadorEgypt, Arab Rep.El SalvadorEquatorial GuineaEritreaEstoniaEthiopiaEuro areaEurope & Central AsiaEurope & Central Asia (excluding high income)Europe & Central Asia (IDA & IBRD countries)European UnionFaroe IslandsFijiFinlandFragile and conflict affected situationsFranceFrench PolynesiaGabonGambia, TheGeorgiaGermanyGhanaGibraltarGreeceGreenlandGrenadaGuamGuatemalaGuineaGuinea-BissauGuyanaHaitiHeavily indebted poor countries (HIPC)High incomeHondurasHong Kong SAR, ChinaHungaryIBRD onlyIcelandIDA & IBRD totalIDA blendIDA onlyIDA totalIndiaIndonesiaIran, Islamic Rep.IraqIrelandIsraelItalyJamaicaJapanJordanKazakhstanKenyaKiribatiKorea, Dem. People’s Rep.Korea, Rep.KuwaitKyrgyz RepublicLao PDRLate-demographic dividendLatin America & Caribbean Latin America & Caribbean (excluding high income)Latin America & the Caribbean (IDA & IBRD countries)LatviaLeast developed countries: UN classificationLebanonLesothoLiberiaLibyaLithuaniaLow & middle incomeLow incomeLower middle incomeLuxembourgMacao SAR, ChinaMacedonia, FYRMadagascarMalawiMalaysiaMaldivesMaliMaltaMarshall IslandsMauritaniaMauritiusMexicoMicronesia, Fed. Sts.Middle East & North AfricaMiddle East & North Africa (excluding high income)Middle East & North Africa (IDA & IBRD countries)Middle incomeMoldovaMongoliaMoroccoMozambiqueMyanmarNamibiaNauruNepalNetherlandsNew CaledoniaNew ZealandNicaraguaNigerNigeriaNorth AmericaNorthern Mariana IslandsNorwayOECD membersOmanOther small statesPacific island small statesPakistanPalauPanamaPapua New GuineaParaguayPeruPhilippinesPolandPortugalPost-demographic dividendPre-demographic dividendPuerto RicoQatarRomaniaRussian FederationRwandaSamoaSao Tome and PrincipeSaudi ArabiaSenegalSerbiaSeychellesSierra LeoneSingaporeSlovak RepublicSloveniaSmall statesSolomon IslandsSomaliaSouth AfricaSouth AsiaSouth Asia (IDA & IBRD)SpainSri LankaSt. Kitts and NevisSt. LuciaSt. Vincent and the GrenadinesSub-Saharan Africa Sub-Saharan Africa (excluding high income)Sub-Saharan Africa (IDA & IBRD countries)SudanSurinameSwazilandSwedenSwitzerlandSyrian Arab RepublicTajikistanTanzaniaThailandTimor-LesteTogoTongaTrinidad and TobagoTunisiaTurkeyTurkmenistanTurks and Caicos IslandsTuvaluUgandaUkraineUnited Arab EmiratesUnited KingdomUnited StatesUpper middle incomeUruguayUzbekistanVanuatuVenezuela, RBVietnamVirgin Islands (U.S.)WorldYemen, Rep.ZambiaZimbabwe Linha do tempo:
Nesta escala de tempo está apresentado um gráfico de 1971 ano até 2009 ano Cayman Islands. Dados de 1970 ano ausente. O número de observações reais por data: 39.
Fonte (nome):
Indicadores de desenvolvimento mundial
Fonte (organização):
World Bank staff estimates from original source: European Commission, Joint Research Centre (JRC)/Netherlands Environmental Assessment Agency (PBL). Emission Database for Global Atmospheric Research (EDGAR): http://edgar.jrc.ec.europa.eu/.
Categorias:
Agriculture & Rural Development, Environment
Foi atualizado:
23 abr 2017 ano
Indicadores de alterações dos valores ao longo dos anos
Mínimo:
5.155
1 jan 2009 ano
Máximo:
71.185
1 jan 1972 ano
Na data de observação
Valor
Mudança absoluta
A alteração em relação ao valor anterior
1 jan 1971 ano
70.607
+70.607
0.0%
1 jan 1972 ano
71.185
+0.578
0.82%
1 jan 1973 ano
68.174
-3.011
-4.23%
1 jan 1974 ano
67.986
-0.189
-0.28%
1 jan 1975 ano
63.89
-4.096
-6.02%
1 jan 1976 ano
60.874
-3.016
-4.72%
1 jan 1977 ano
61.355
+0.481
0.79%
1 jan 1978 ano
60.782
-0.573
-0.93%
1 jan 1979 ano
59.618
-1.163
-1.91%
1 jan 1980 ano
59.917
+0.298
0.5%
1 jan 1981 ano
54.469
-5.448
-9.09%
1 jan 1982 ano
51.688
-2.781
-5.11%
1 jan 1983 ano
51.094
-0.594
-1.15%
1 jan 1984 ano
57.183
+6.089
11.92%
1 jan 1985 ano
24.827
-32.356
-56.58%
1 jan 1986 ano
27.272
+2.445
9.85%
1 jan 1987 ano
28.646
+1.374
5.04%
1 jan 1988 ano
27.184
-1.462
-5.1%
1 jan 1989 ano
10.897
-16.287
-59.91%
1 jan 1990 ano
10.667
-0.23
-2.11%
1 jan 1991 ano
12.288
+1.62
15.19%
1 jan 1992 ano
9.242
-3.046
-24.79%
1 jan 1993 ano
8.316
-0.926
-10.02%
1 jan 1994 ano
9.293
+0.976
11.74%
1 jan 1995 ano
7.945
-1.347
-14.5%
1 jan 1996 ano
7.45
-0.495
-6.24%
1 jan 1997 ano
7.593
+0.143
1.91%
1 jan 1998 ano
7.854
+0.261
3.44%
1 jan 1999 ano
5.878
-1.976
-25.16%
1 jan 2000 ano
5.746
-0.132
-2.25%
1 jan 2001 ano
6.318
+0.572
9.96%
1 jan 2002 ano
6.292
-0.026
-0.41%
1 jan 2003 ano
6.36
+0.067
1.07%
1 jan 2004 ano
6.491
+0.131
2.06%
1 jan 2005 ano
5.817
-0.674
-10.38%
1 jan 2006 ano
5.81
-0.007
-0.11%
1 jan 2007 ano
5.673
-0.137
-2.36%
1 jan 2008 ano
5.415
-0.258
-4.55%
1 jan 2009 ano
5.155
-0.26
-4.8%
Classificação de países por estatísticas atuais por anos


Comentários: