29
/pt/
pt
AIzaSyAYiBZKx7MnpbEhh9jyipgxe19OcubqV5w
April 1, 2024
217938
Panama
PAN
true
2
1
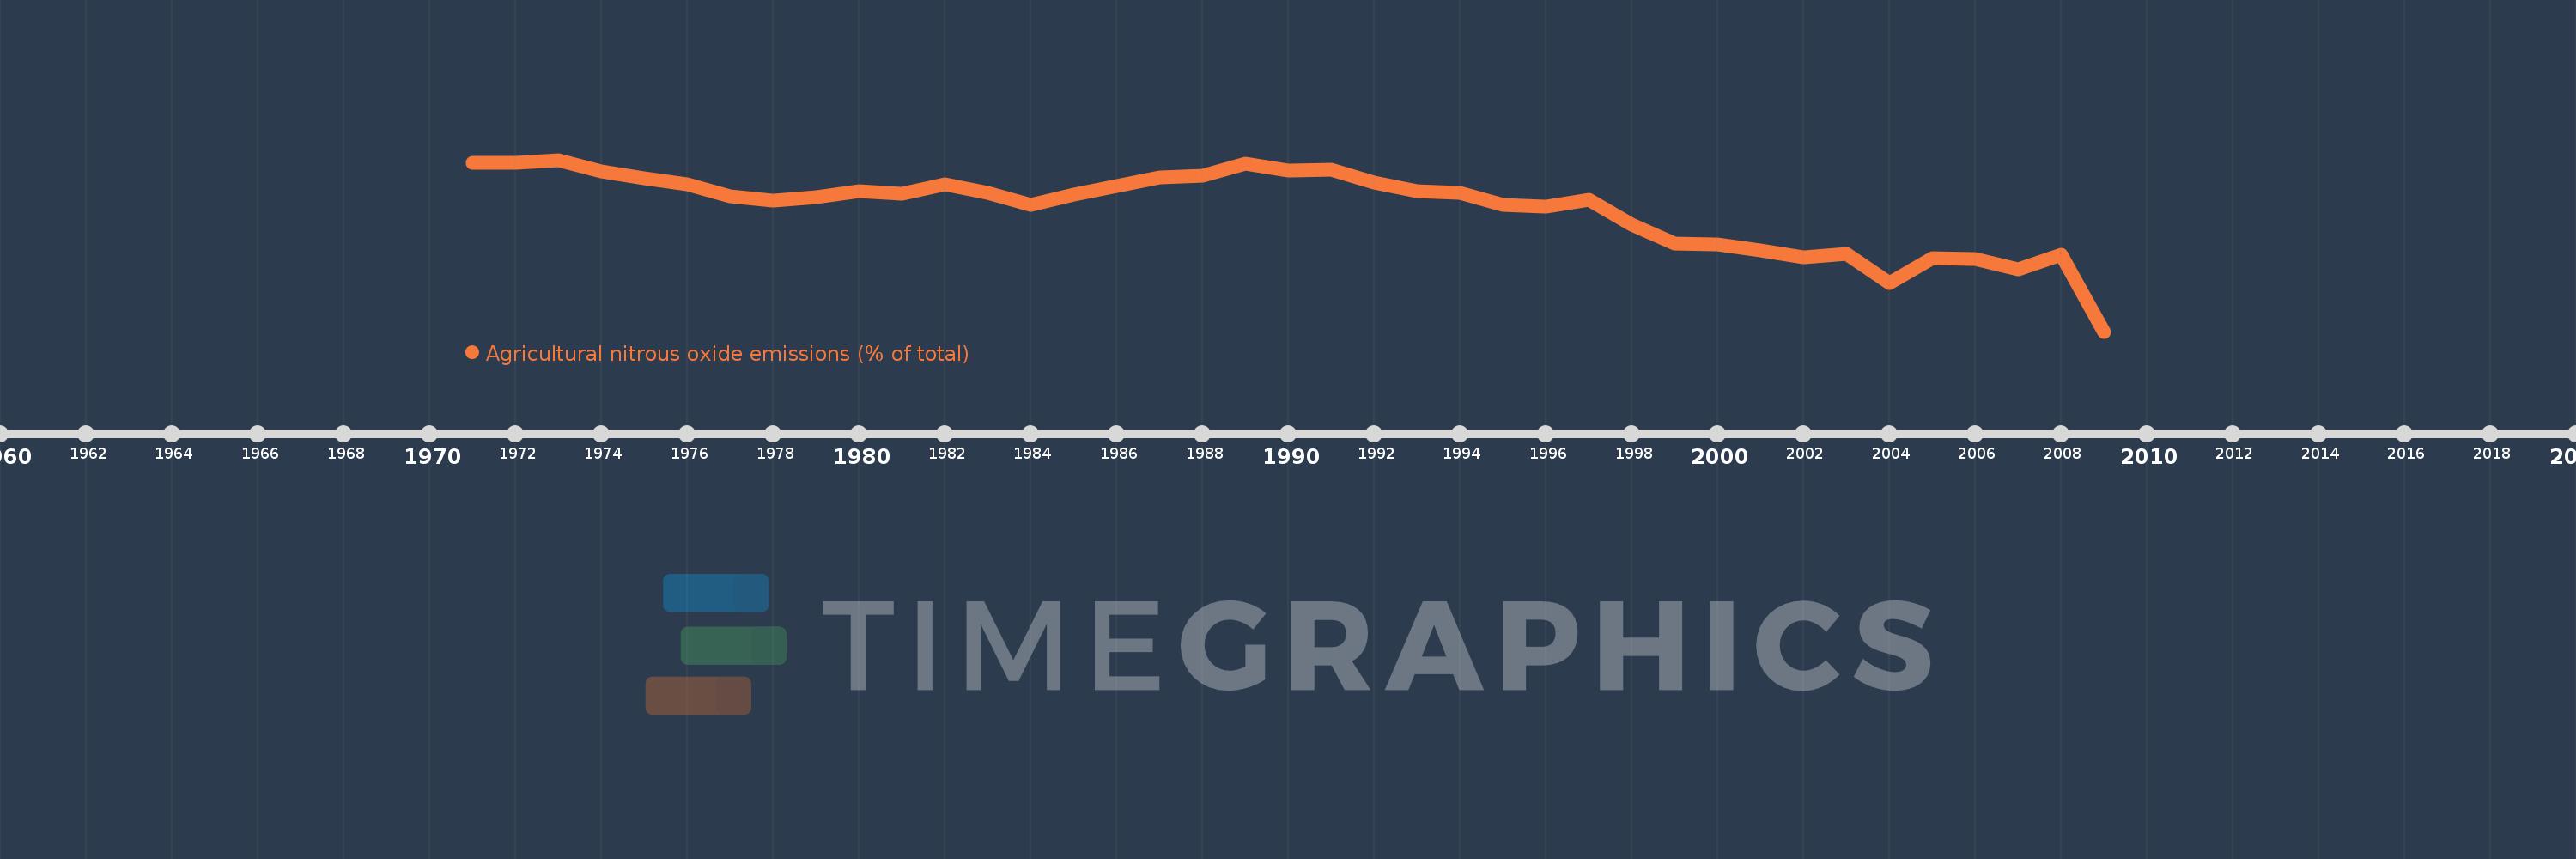
Agricultural nitrous oxide emissions (% of total)
2009,2008,2007,2006,2005,2004,2003,2002,2001,2000,1999,1998,1997,1996,1995,1994,1993,1992,1991,1990,1989,1988,1987,1986,1985,1984,1983,1982,1981,1980,1979,1978,1977,1976,1975,1974,1973,1972,1971
Estas estatísticas em outros países:
AfghanistanAlbaniaAlgeriaAmerican SamoaAndorraAngolaAntigua and BarbudaArab WorldArgentinaArmeniaArubaAustraliaAustriaAzerbaijanBahamas, TheBahrainBangladeshBarbadosBelarusBelgiumBelizeBeninBermudaBhutanBoliviaBosnia and HerzegovinaBotswanaBrazilBritish Virgin IslandsBrunei DarussalamBulgariaBurkina FasoBurundiCabo VerdeCambodiaCameroonCanadaCaribbean small statesCayman IslandsCentral African RepublicCentral Europe and the BalticsChadChileChinaColombiaComorosCongo, Dem. Rep.Congo, Rep.Costa RicaCote d'IvoireCroatiaCubaCyprusCzech RepublicDenmarkDjiboutiDominicaDominican RepublicEarly-demographic dividendEast Asia & PacificEast Asia & Pacific (excluding high income)East Asia & Pacific (IDA & IBRD countries)EcuadorEgypt, Arab Rep.El SalvadorEquatorial GuineaEritreaEstoniaEthiopiaEuro areaEurope & Central AsiaEurope & Central Asia (excluding high income)Europe & Central Asia (IDA & IBRD countries)European UnionFaroe IslandsFijiFinlandFragile and conflict affected situationsFranceFrench PolynesiaGabonGambia, TheGeorgiaGermanyGhanaGibraltarGreeceGreenlandGrenadaGuamGuatemalaGuineaGuinea-BissauGuyanaHaitiHeavily indebted poor countries (HIPC)High incomeHondurasHong Kong SAR, ChinaHungaryIBRD onlyIcelandIDA & IBRD totalIDA blendIDA onlyIDA totalIndiaIndonesiaIran, Islamic Rep.IraqIrelandIsraelItalyJamaicaJapanJordanKazakhstanKenyaKiribatiKorea, Dem. People’s Rep.Korea, Rep.KuwaitKyrgyz RepublicLao PDRLate-demographic dividendLatin America & Caribbean Latin America & Caribbean (excluding high income)Latin America & the Caribbean (IDA & IBRD countries)LatviaLeast developed countries: UN classificationLebanonLesothoLiberiaLibyaLithuaniaLow & middle incomeLow incomeLower middle incomeLuxembourgMacao SAR, ChinaMacedonia, FYRMadagascarMalawiMalaysiaMaldivesMaliMaltaMarshall IslandsMauritaniaMauritiusMexicoMicronesia, Fed. Sts.Middle East & North AfricaMiddle East & North Africa (excluding high income)Middle East & North Africa (IDA & IBRD countries)Middle incomeMoldovaMongoliaMoroccoMozambiqueMyanmarNamibiaNauruNepalNetherlandsNew CaledoniaNew ZealandNicaraguaNigerNigeriaNorth AmericaNorthern Mariana IslandsNorwayOECD membersOmanOther small statesPacific island small statesPakistanPalauPanamaPapua New GuineaParaguayPeruPhilippinesPolandPortugalPost-demographic dividendPre-demographic dividendPuerto RicoQatarRomaniaRussian FederationRwandaSamoaSao Tome and PrincipeSaudi ArabiaSenegalSerbiaSeychellesSierra LeoneSingaporeSlovak RepublicSloveniaSmall statesSolomon IslandsSomaliaSouth AfricaSouth AsiaSouth Asia (IDA & IBRD)SpainSri LankaSt. Kitts and NevisSt. LuciaSt. Vincent and the GrenadinesSub-Saharan Africa Sub-Saharan Africa (excluding high income)Sub-Saharan Africa (IDA & IBRD countries)SudanSurinameSwazilandSwedenSwitzerlandSyrian Arab RepublicTajikistanTanzaniaThailandTimor-LesteTogoTongaTrinidad and TobagoTunisiaTurkeyTurkmenistanTurks and Caicos IslandsTuvaluUgandaUkraineUnited Arab EmiratesUnited KingdomUnited StatesUpper middle incomeUruguayUzbekistanVanuatuVenezuela, RBVietnamVirgin Islands (U.S.)WorldYemen, Rep.ZambiaZimbabwe Linha do tempo:
Nesta escala de tempo está apresentado um gráfico de 1971 ano até 2009 ano Panama. Dados de 1970 ano ausente. O número de observações reais por data: 39.
Fonte (nome):
Indicadores de desenvolvimento mundial
Fonte (organização):
World Bank staff estimates from original source: European Commission, Joint Research Centre (JRC)/Netherlands Environmental Assessment Agency (PBL). Emission Database for Global Atmospheric Research (EDGAR): http://edgar.jrc.ec.europa.eu/.
Categorias:
Agriculture & Rural Development, Environment
Foi atualizado:
23 abr 2017 ano
Indicadores de alterações dos valores ao longo dos anos
Mínimo:
78.903
1 jan 2009 ano
Máximo:
89.553
1 jan 1973 ano
Na data de observação
Valor
Mudança absoluta
A alteração em relação ao valor anterior
1 jan 1971 ano
89.384
+89.384
0.0%
1 jan 1972 ano
89.353
-0.031
-0.04%
1 jan 1973 ano
89.553
+0.2
0.22%
1 jan 1974 ano
88.814
-0.739
-0.82%
1 jan 1975 ano
88.421
-0.394
-0.44%
1 jan 1976 ano
88.023
-0.397
-0.45%
1 jan 1977 ano
87.298
-0.726
-0.82%
1 jan 1978 ano
87.011
-0.286
-0.33%
1 jan 1979 ano
87.257
+0.245
0.28%
1 jan 1980 ano
87.589
+0.333
0.38%
1 jan 1981 ano
87.462
-0.128
-0.15%
1 jan 1982 ano
88.028
+0.566
0.65%
1 jan 1983 ano
87.494
-0.534
-0.61%
1 jan 1984 ano
86.763
-0.732
-0.84%
1 jan 1985 ano
87.401
+0.639
0.74%
1 jan 1986 ano
87.925
+0.524
0.6%
1 jan 1987 ano
88.448
+0.522
0.59%
1 jan 1988 ano
88.582
+0.134
0.15%
1 jan 1989 ano
89.312
+0.73
0.82%
1 jan 1990 ano
88.904
-0.408
-0.46%
1 jan 1991 ano
88.965
+0.062
0.07%
1 jan 1992 ano
88.129
-0.836
-0.94%
1 jan 1993 ano
87.606
-0.523
-0.59%
1 jan 1994 ano
87.525
-0.082
-0.09%
1 jan 1995 ano
86.779
-0.746
-0.85%
1 jan 1996 ano
86.653
-0.126
-0.14%
1 jan 1997 ano
87.074
+0.421
0.49%
1 jan 1998 ano
85.515
-1.558
-1.79%
1 jan 1999 ano
84.385
-1.13
-1.32%
1 jan 2000 ano
84.308
-0.078
-0.09%
1 jan 2001 ano
83.945
-0.363
-0.43%
1 jan 2002 ano
83.533
-0.411
-0.49%
1 jan 2003 ano
83.741
+0.207
0.25%
1 jan 2004 ano
81.922
-1.819
-2.17%
1 jan 2005 ano
83.433
+1.511
1.84%
1 jan 2006 ano
83.405
-0.028
-0.03%
1 jan 2007 ano
82.767
-0.638
-0.77%
1 jan 2008 ano
83.661
+0.893
1.08%
1 jan 2009 ano
78.903
-4.758
-5.69%
Classificação de países por estatísticas atuais por anos


Comentários: