29
/pt/
pt
AIzaSyAYiBZKx7MnpbEhh9jyipgxe19OcubqV5w
April 1, 2024
156963
Iran, Islamic Rep.
IRN
true
2
1
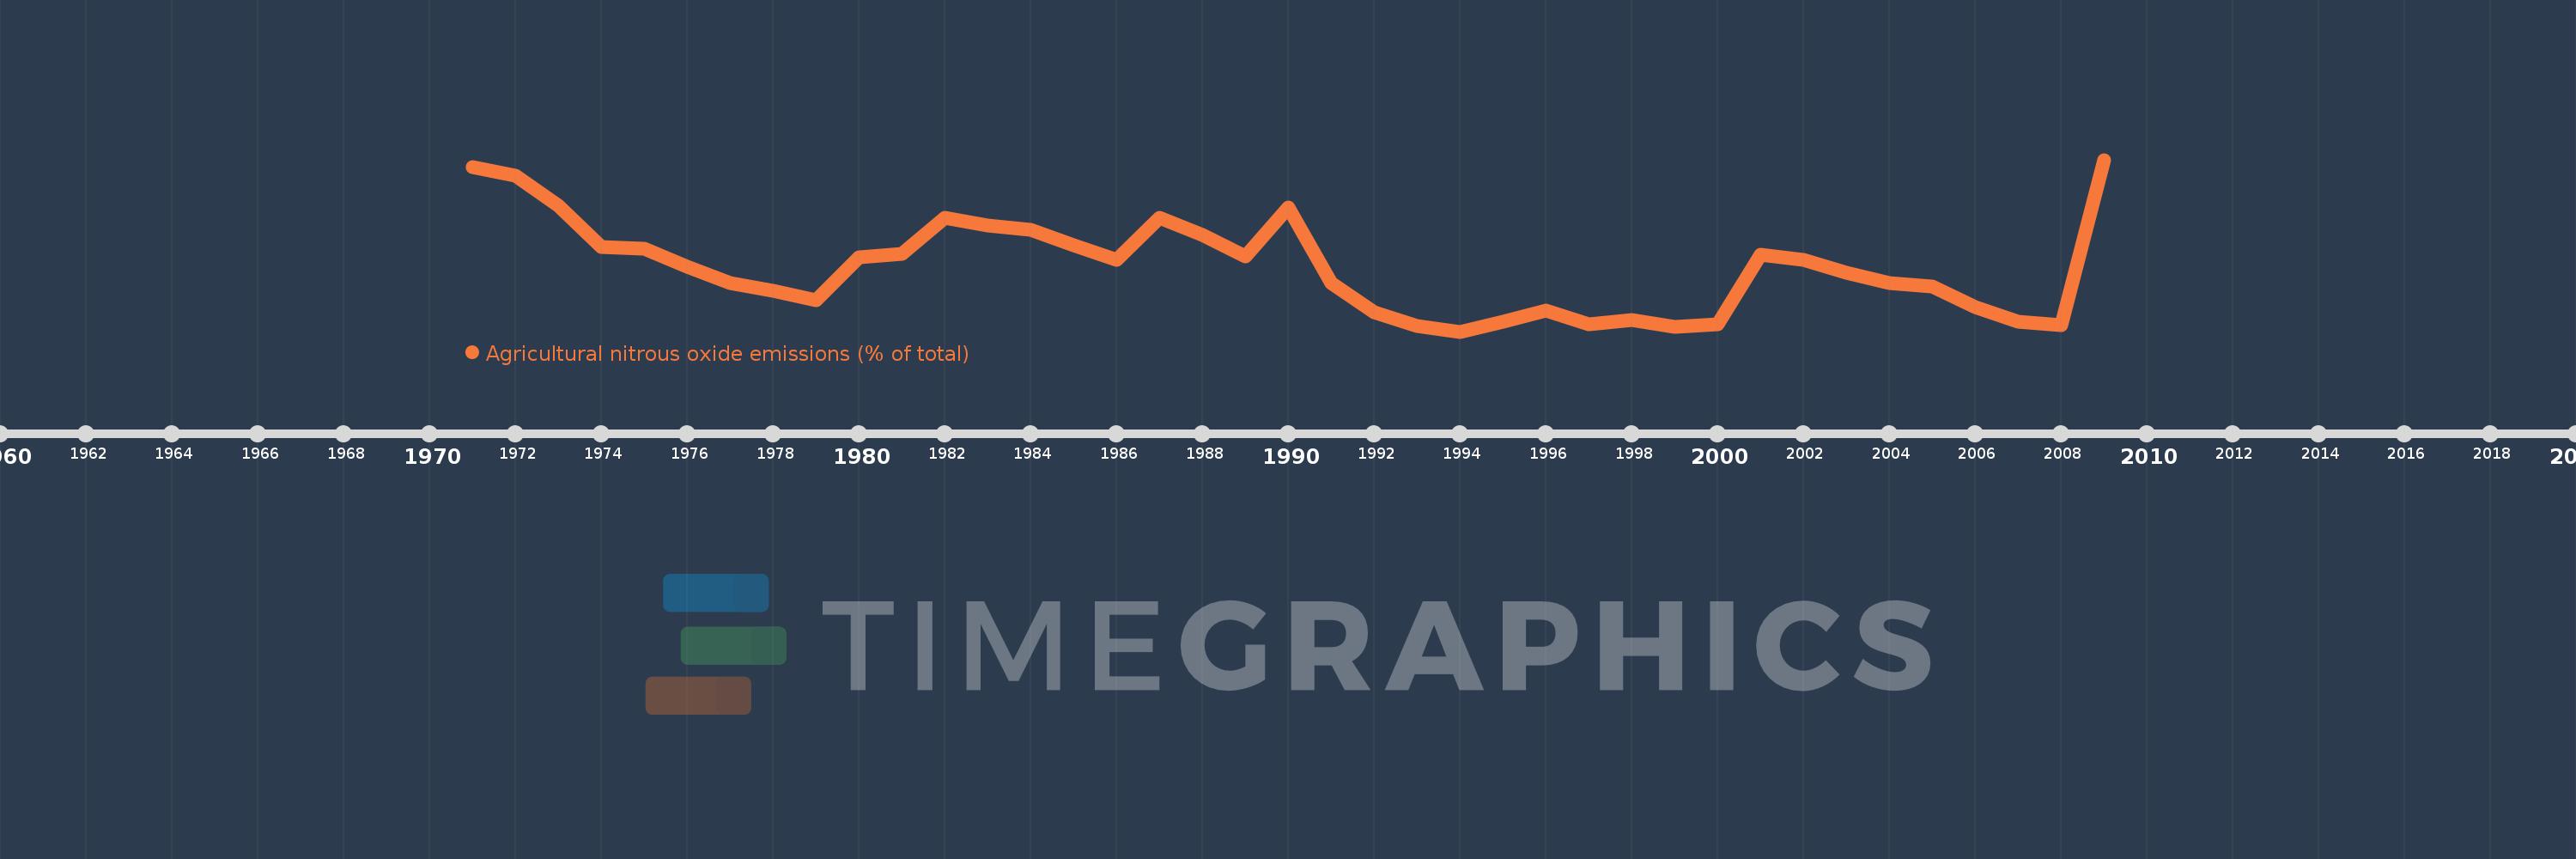
Agricultural nitrous oxide emissions (% of total)
2009,2008,2007,2006,2005,2004,2003,2002,2001,2000,1999,1998,1997,1996,1995,1994,1993,1992,1991,1990,1989,1988,1987,1986,1985,1984,1983,1982,1981,1980,1979,1978,1977,1976,1975,1974,1973,1972,1971
Estas estatísticas em outros países:
AfghanistanAlbaniaAlgeriaAmerican SamoaAndorraAngolaAntigua and BarbudaArab WorldArgentinaArmeniaArubaAustraliaAustriaAzerbaijanBahamas, TheBahrainBangladeshBarbadosBelarusBelgiumBelizeBeninBermudaBhutanBoliviaBosnia and HerzegovinaBotswanaBrazilBritish Virgin IslandsBrunei DarussalamBulgariaBurkina FasoBurundiCabo VerdeCambodiaCameroonCanadaCaribbean small statesCayman IslandsCentral African RepublicCentral Europe and the BalticsChadChileChinaColombiaComorosCongo, Dem. Rep.Congo, Rep.Costa RicaCote d'IvoireCroatiaCubaCyprusCzech RepublicDenmarkDjiboutiDominicaDominican RepublicEarly-demographic dividendEast Asia & PacificEast Asia & Pacific (excluding high income)East Asia & Pacific (IDA & IBRD countries)EcuadorEgypt, Arab Rep.El SalvadorEquatorial GuineaEritreaEstoniaEthiopiaEuro areaEurope & Central AsiaEurope & Central Asia (excluding high income)Europe & Central Asia (IDA & IBRD countries)European UnionFaroe IslandsFijiFinlandFragile and conflict affected situationsFranceFrench PolynesiaGabonGambia, TheGeorgiaGermanyGhanaGibraltarGreeceGreenlandGrenadaGuamGuatemalaGuineaGuinea-BissauGuyanaHaitiHeavily indebted poor countries (HIPC)High incomeHondurasHong Kong SAR, ChinaHungaryIBRD onlyIcelandIDA & IBRD totalIDA blendIDA onlyIDA totalIndiaIndonesiaIran, Islamic Rep.IraqIrelandIsraelItalyJamaicaJapanJordanKazakhstanKenyaKiribatiKorea, Dem. People’s Rep.Korea, Rep.KuwaitKyrgyz RepublicLao PDRLate-demographic dividendLatin America & Caribbean Latin America & Caribbean (excluding high income)Latin America & the Caribbean (IDA & IBRD countries)LatviaLeast developed countries: UN classificationLebanonLesothoLiberiaLibyaLithuaniaLow & middle incomeLow incomeLower middle incomeLuxembourgMacao SAR, ChinaMacedonia, FYRMadagascarMalawiMalaysiaMaldivesMaliMaltaMarshall IslandsMauritaniaMauritiusMexicoMicronesia, Fed. Sts.Middle East & North AfricaMiddle East & North Africa (excluding high income)Middle East & North Africa (IDA & IBRD countries)Middle incomeMoldovaMongoliaMoroccoMozambiqueMyanmarNamibiaNauruNepalNetherlandsNew CaledoniaNew ZealandNicaraguaNigerNigeriaNorth AmericaNorthern Mariana IslandsNorwayOECD membersOmanOther small statesPacific island small statesPakistanPalauPanamaPapua New GuineaParaguayPeruPhilippinesPolandPortugalPost-demographic dividendPre-demographic dividendPuerto RicoQatarRomaniaRussian FederationRwandaSamoaSao Tome and PrincipeSaudi ArabiaSenegalSerbiaSeychellesSierra LeoneSingaporeSlovak RepublicSloveniaSmall statesSolomon IslandsSomaliaSouth AfricaSouth AsiaSouth Asia (IDA & IBRD)SpainSri LankaSt. Kitts and NevisSt. LuciaSt. Vincent and the GrenadinesSub-Saharan Africa Sub-Saharan Africa (excluding high income)Sub-Saharan Africa (IDA & IBRD countries)SudanSurinameSwazilandSwedenSwitzerlandSyrian Arab RepublicTajikistanTanzaniaThailandTimor-LesteTogoTongaTrinidad and TobagoTunisiaTurkeyTurkmenistanTurks and Caicos IslandsTuvaluUgandaUkraineUnited Arab EmiratesUnited KingdomUnited StatesUpper middle incomeUruguayUzbekistanVanuatuVenezuela, RBVietnamVirgin Islands (U.S.)WorldYemen, Rep.ZambiaZimbabwe Linha do tempo:
Nesta escala de tempo está apresentado um gráfico de 1971 ano até 2009 ano Iran, Islamic Rep.. Dados de 1970 ano ausente. O número de observações reais por data: 39.
Fonte (nome):
Indicadores de desenvolvimento mundial
Fonte (organização):
World Bank staff estimates from original source: European Commission, Joint Research Centre (JRC)/Netherlands Environmental Assessment Agency (PBL). Emission Database for Global Atmospheric Research (EDGAR): http://edgar.jrc.ec.europa.eu/.
Categorias:
Agriculture & Rural Development, Environment
Foi atualizado:
23 abr 2017 ano
Indicadores de alterações dos valores ao longo dos anos
Mínimo:
72.686
1 jan 1994 ano
Máximo:
80.695
1 jan 2009 ano
Na data de observação
Valor
Mudança absoluta
A alteração em relação ao valor anterior
1 jan 1971 ano
80.358
+80.358
0.0%
1 jan 1972 ano
79.952
-0.406
-0.51%
1 jan 1973 ano
78.545
-1.406
-1.76%
1 jan 1974 ano
76.63
-1.915
-2.44%
1 jan 1975 ano
76.566
-0.064
-0.08%
1 jan 1976 ano
75.701
-0.865
-1.13%
1 jan 1977 ano
74.929
-0.772
-1.02%
1 jan 1978 ano
74.586
-0.343
-0.46%
1 jan 1979 ano
74.141
-0.445
-0.6%
1 jan 1980 ano
76.136
+1.995
2.69%
1 jan 1981 ano
76.321
+0.186
0.24%
1 jan 1982 ano
77.981
+1.66
2.18%
1 jan 1983 ano
77.619
-0.363
-0.47%
1 jan 1984 ano
77.418
-0.201
-0.26%
1 jan 1985 ano
76.723
-0.694
-0.9%
1 jan 1986 ano
76.031
-0.692
-0.9%
1 jan 1987 ano
78.01
+1.979
2.6%
1 jan 1988 ano
77.2
-0.81
-1.04%
1 jan 1989 ano
76.17
-1.03
-1.33%
1 jan 1990 ano
78.48
+2.31
3.03%
1 jan 1991 ano
74.946
-3.534
-4.5%
1 jan 1992 ano
73.586
-1.36
-1.81%
1 jan 1993 ano
72.958
-0.628
-0.85%
1 jan 1994 ano
72.686
-0.272
-0.37%
1 jan 1995 ano
73.142
+0.456
0.63%
1 jan 1996 ano
73.656
+0.514
0.7%
1 jan 1997 ano
73.022
-0.634
-0.86%
1 jan 1998 ano
73.212
+0.19
0.26%
1 jan 1999 ano
72.891
-0.321
-0.44%
1 jan 2000 ano
73.041
+0.151
0.21%
1 jan 2001 ano
76.278
+3.237
4.43%
1 jan 2002 ano
76.04
-0.239
-0.31%
1 jan 2003 ano
75.426
-0.614
-0.81%
1 jan 2004 ano
74.957
-0.468
-0.62%
1 jan 2005 ano
74.8
-0.158
-0.21%
1 jan 2006 ano
73.808
-0.991
-1.33%
1 jan 2007 ano
73.166
-0.642
-0.87%
1 jan 2008 ano
72.992
-0.174
-0.24%
1 jan 2009 ano
80.695
+7.703
10.55%
Classificação de países por estatísticas atuais por anos


Comentários: