29
/pt/
pt
AIzaSyAYiBZKx7MnpbEhh9jyipgxe19OcubqV5w
April 1, 2024
275411
United Kingdom
GBR
true
2
1
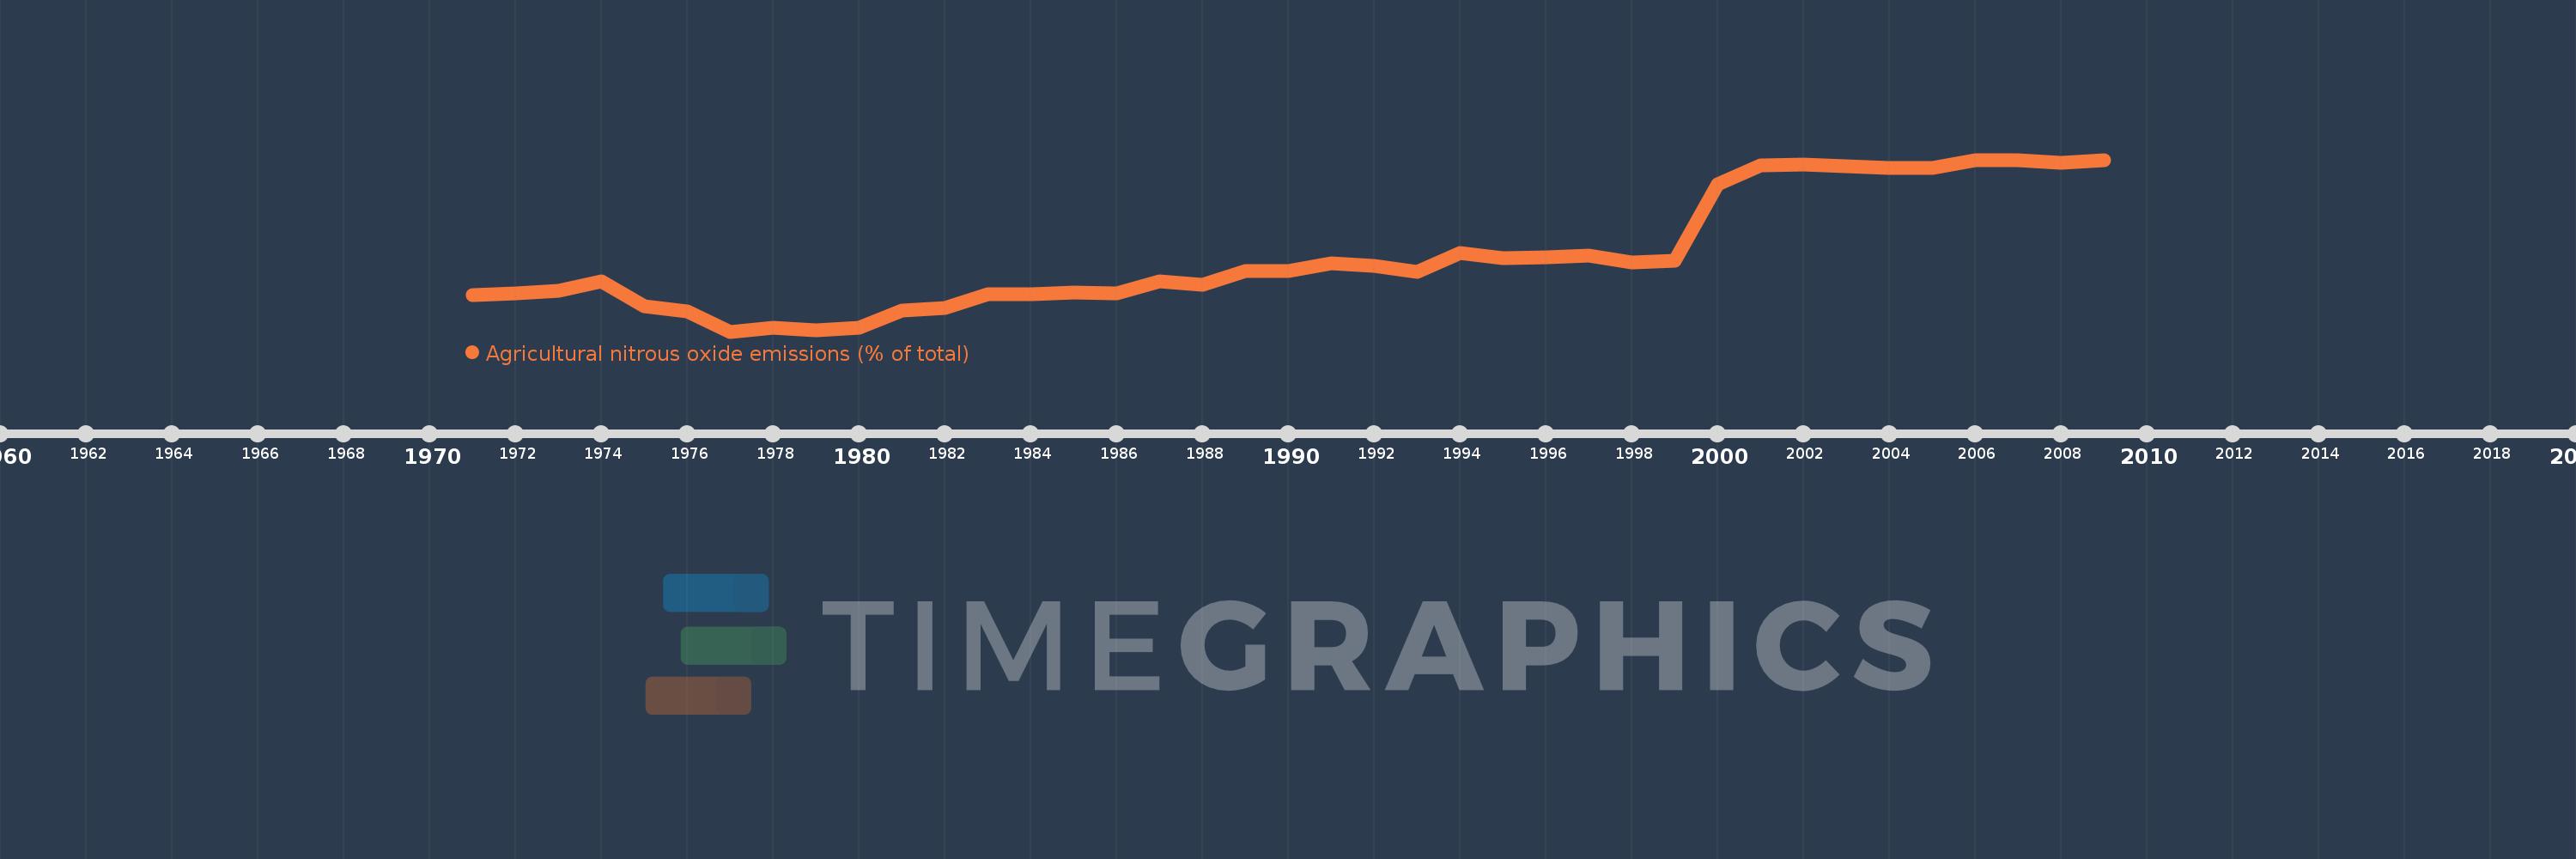
Agricultural nitrous oxide emissions (% of total)
2009,2008,2007,2006,2005,2004,2003,2002,2001,2000,1999,1998,1997,1996,1995,1994,1993,1992,1991,1990,1989,1988,1987,1986,1985,1984,1983,1982,1981,1980,1979,1978,1977,1976,1975,1974,1973,1972,1971
Estas estatísticas em outros países:
AfghanistanAlbaniaAlgeriaAmerican SamoaAndorraAngolaAntigua and BarbudaArab WorldArgentinaArmeniaArubaAustraliaAustriaAzerbaijanBahamas, TheBahrainBangladeshBarbadosBelarusBelgiumBelizeBeninBermudaBhutanBoliviaBosnia and HerzegovinaBotswanaBrazilBritish Virgin IslandsBrunei DarussalamBulgariaBurkina FasoBurundiCabo VerdeCambodiaCameroonCanadaCaribbean small statesCayman IslandsCentral African RepublicCentral Europe and the BalticsChadChileChinaColombiaComorosCongo, Dem. Rep.Congo, Rep.Costa RicaCote d'IvoireCroatiaCubaCyprusCzech RepublicDenmarkDjiboutiDominicaDominican RepublicEarly-demographic dividendEast Asia & PacificEast Asia & Pacific (excluding high income)East Asia & Pacific (IDA & IBRD countries)EcuadorEgypt, Arab Rep.El SalvadorEquatorial GuineaEritreaEstoniaEthiopiaEuro areaEurope & Central AsiaEurope & Central Asia (excluding high income)Europe & Central Asia (IDA & IBRD countries)European UnionFaroe IslandsFijiFinlandFragile and conflict affected situationsFranceFrench PolynesiaGabonGambia, TheGeorgiaGermanyGhanaGibraltarGreeceGreenlandGrenadaGuamGuatemalaGuineaGuinea-BissauGuyanaHaitiHeavily indebted poor countries (HIPC)High incomeHondurasHong Kong SAR, ChinaHungaryIBRD onlyIcelandIDA & IBRD totalIDA blendIDA onlyIDA totalIndiaIndonesiaIran, Islamic Rep.IraqIrelandIsraelItalyJamaicaJapanJordanKazakhstanKenyaKiribatiKorea, Dem. People’s Rep.Korea, Rep.KuwaitKyrgyz RepublicLao PDRLate-demographic dividendLatin America & Caribbean Latin America & Caribbean (excluding high income)Latin America & the Caribbean (IDA & IBRD countries)LatviaLeast developed countries: UN classificationLebanonLesothoLiberiaLibyaLithuaniaLow & middle incomeLow incomeLower middle incomeLuxembourgMacao SAR, ChinaMacedonia, FYRMadagascarMalawiMalaysiaMaldivesMaliMaltaMarshall IslandsMauritaniaMauritiusMexicoMicronesia, Fed. Sts.Middle East & North AfricaMiddle East & North Africa (excluding high income)Middle East & North Africa (IDA & IBRD countries)Middle incomeMoldovaMongoliaMoroccoMozambiqueMyanmarNamibiaNauruNepalNetherlandsNew CaledoniaNew ZealandNicaraguaNigerNigeriaNorth AmericaNorthern Mariana IslandsNorwayOECD membersOmanOther small statesPacific island small statesPakistanPalauPanamaPapua New GuineaParaguayPeruPhilippinesPolandPortugalPost-demographic dividendPre-demographic dividendPuerto RicoQatarRomaniaRussian FederationRwandaSamoaSao Tome and PrincipeSaudi ArabiaSenegalSerbiaSeychellesSierra LeoneSingaporeSlovak RepublicSloveniaSmall statesSolomon IslandsSomaliaSouth AfricaSouth AsiaSouth Asia (IDA & IBRD)SpainSri LankaSt. Kitts and NevisSt. LuciaSt. Vincent and the GrenadinesSub-Saharan Africa Sub-Saharan Africa (excluding high income)Sub-Saharan Africa (IDA & IBRD countries)SudanSurinameSwazilandSwedenSwitzerlandSyrian Arab RepublicTajikistanTanzaniaThailandTimor-LesteTogoTongaTrinidad and TobagoTunisiaTurkeyTurkmenistanTurks and Caicos IslandsTuvaluUgandaUkraineUnited Arab EmiratesUnited KingdomUnited StatesUpper middle incomeUruguayUzbekistanVanuatuVenezuela, RBVietnamVirgin Islands (U.S.)WorldYemen, Rep.ZambiaZimbabwe Linha do tempo:
Nesta escala de tempo está apresentado um gráfico de 1971 ano até 2009 ano United Kingdom. Dados de 1970 ano ausente. O número de observações reais por data: 39.
Fonte (nome):
Indicadores de desenvolvimento mundial
Fonte (organização):
World Bank staff estimates from original source: European Commission, Joint Research Centre (JRC)/Netherlands Environmental Assessment Agency (PBL). Emission Database for Global Atmospheric Research (EDGAR): http://edgar.jrc.ec.europa.eu/.
Categorias:
Agriculture & Rural Development, Environment
Foi atualizado:
23 abr 2017 ano
Indicadores de alterações dos valores ao longo dos anos
Mínimo:
26.569
1 jan 1977 ano
Máximo:
60.915
1 jan 2006 ano
Na data de observação
Valor
Mudança absoluta
A alteração em relação ao valor anterior
1 jan 1971 ano
33.818
+33.818
0.0%
1 jan 1972 ano
34.24
+0.421
1.25%
1 jan 1973 ano
34.737
+0.498
1.45%
1 jan 1974 ano
36.534
+1.797
5.17%
1 jan 1975 ano
31.673
-4.861
-13.3%
1 jan 1976 ano
30.558
-1.116
-3.52%
1 jan 1977 ano
26.569
-3.988
-13.05%
1 jan 1978 ano
27.267
+0.698
2.63%
1 jan 1979 ano
26.78
-0.487
-1.78%
1 jan 1980 ano
27.398
+0.617
2.31%
1 jan 1981 ano
30.84
+3.442
12.56%
1 jan 1982 ano
31.239
+0.399
1.29%
1 jan 1983 ano
33.963
+2.724
8.72%
1 jan 1984 ano
34.112
+0.149
0.44%
1 jan 1985 ano
34.431
+0.319
0.93%
1 jan 1986 ano
34.233
-0.198
-0.58%
1 jan 1987 ano
36.608
+2.375
6.94%
1 jan 1988 ano
35.966
-0.642
-1.75%
1 jan 1989 ano
38.75
+2.784
7.74%
1 jan 1990 ano
38.655
-0.095
-0.24%
1 jan 1991 ano
40.203
+1.548
4.01%
1 jan 1992 ano
39.775
-0.428
-1.06%
1 jan 1993 ano
38.499
-1.276
-3.21%
1 jan 1994 ano
42.364
+3.865
10.04%
1 jan 1995 ano
41.28
-1.084
-2.56%
1 jan 1996 ano
41.36
+0.08
0.19%
1 jan 1997 ano
41.845
+0.485
1.17%
1 jan 1998 ano
40.343
-1.501
-3.59%
1 jan 1999 ano
40.742
+0.399
0.99%
1 jan 2000 ano
55.948
+15.206
37.32%
1 jan 2001 ano
59.736
+3.789
6.77%
1 jan 2002 ano
60.019
+0.282
0.47%
1 jan 2003 ano
59.647
-0.371
-0.62%
1 jan 2004 ano
59.301
-0.346
-0.58%
1 jan 2005 ano
59.231
-0.07
-0.12%
1 jan 2006 ano
60.915
+1.684
2.84%
1 jan 2007 ano
60.902
-0.014
-0.02%
1 jan 2008 ano
60.287
-0.614
-1.01%
1 jan 2009 ano
60.899
+0.612
1.01%
Classificação de países por estatísticas atuais por anos


Comentários: