29
/pt/
pt
AIzaSyAYiBZKx7MnpbEhh9jyipgxe19OcubqV5w
April 1, 2024
67055
Andorra
AND
true
2
1
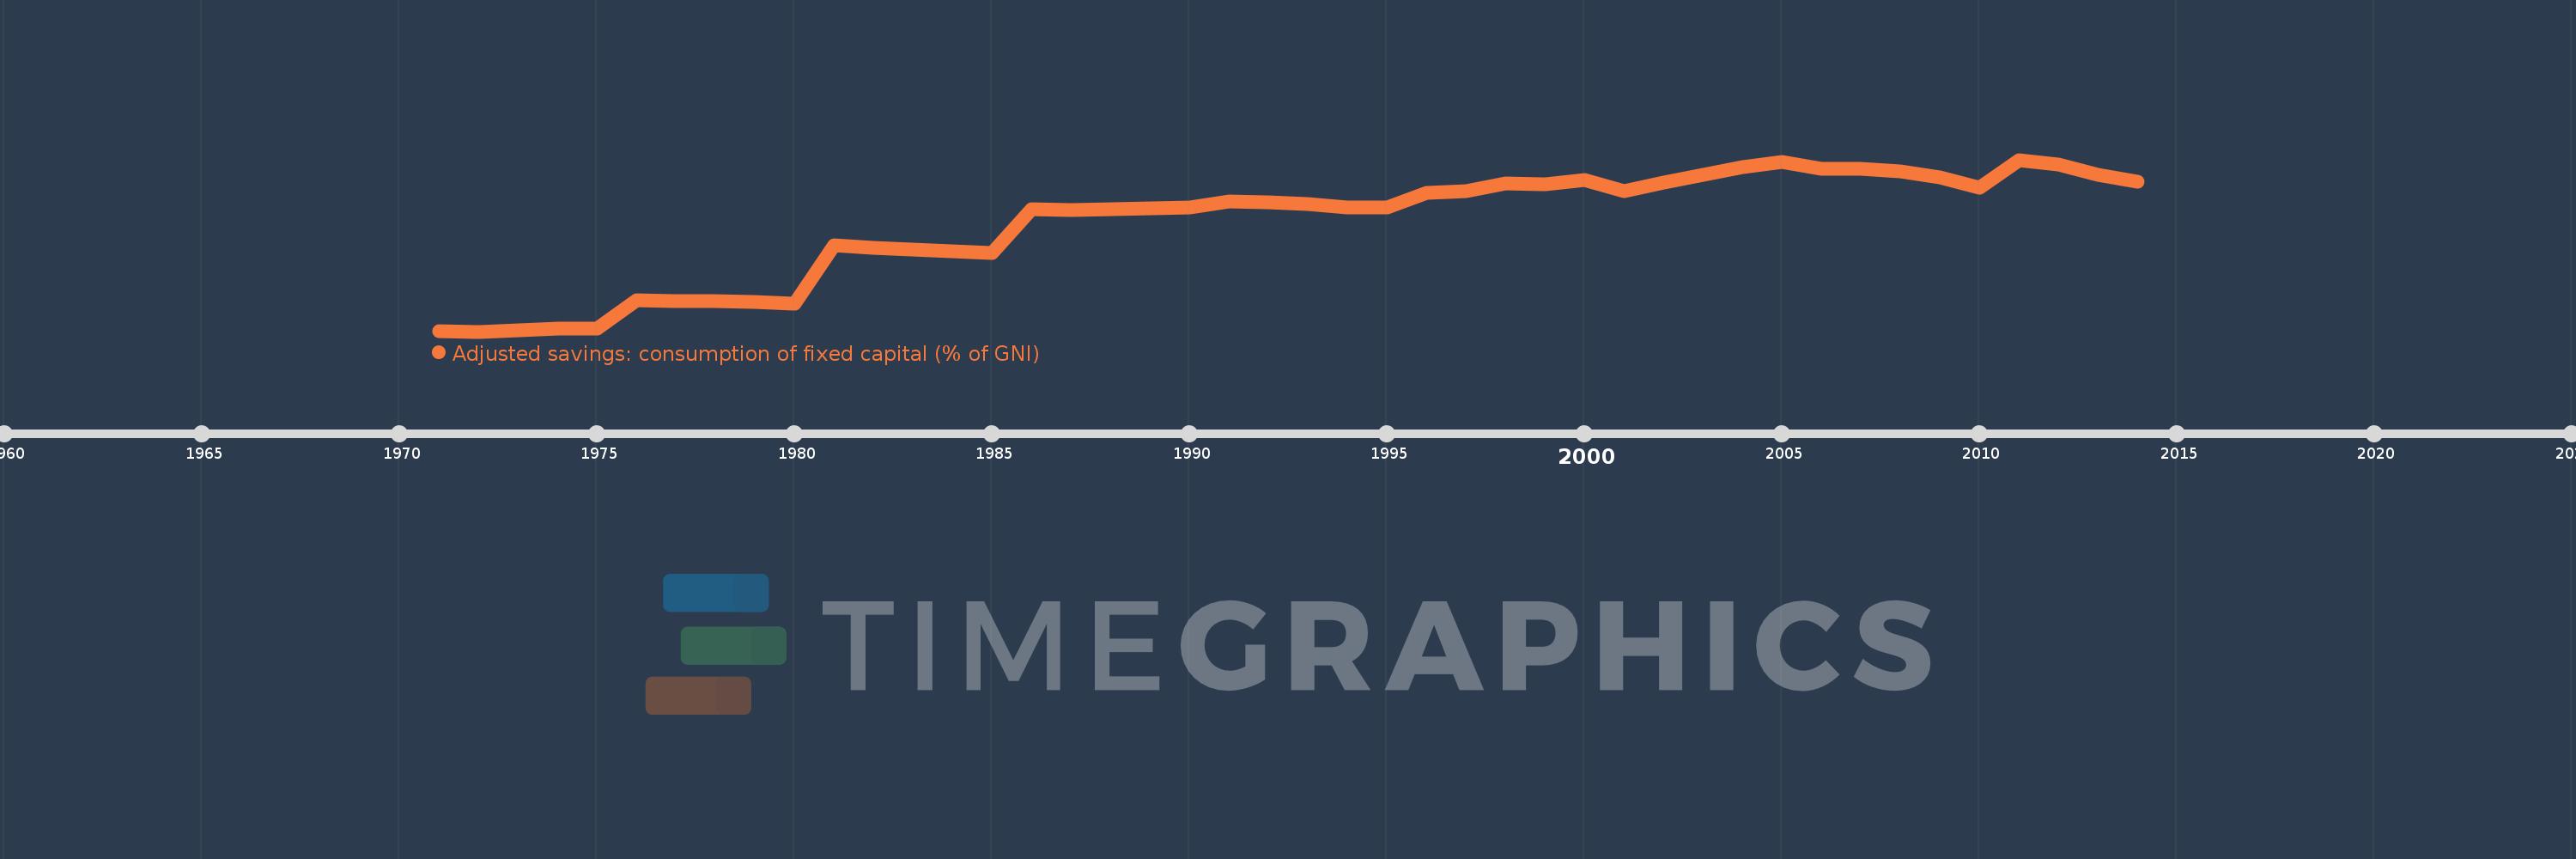
Adjusted savings: consumption of fixed capital (% of GNI)
2014,2013,2012,2011,2010,2009,2008,2007,2006,2005,2004,2003,2002,2001,2000,1999,1998,1997,1996,1995,1994,1993,1992,1991,1990,1989,1988,1987,1986,1985,1984,1983,1982,1981,1980,1979,1978,1977,1976,1975,1974,1973,1972,1971
Estas estatísticas em outros países:
AfghanistanAlbaniaAlgeriaAndorraAngolaAntigua and BarbudaArab WorldArgentinaArmeniaAustraliaAustriaAzerbaijanBahamas, TheBahrainBangladeshBarbadosBelarusBelgiumBelizeBeninBermudaBhutanBoliviaBosnia and HerzegovinaBotswanaBrazilBrunei DarussalamBulgariaBurkina FasoBurundiCabo VerdeCambodiaCameroonCanadaCaribbean small statesCentral African RepublicCentral Europe and the BalticsChadChileChinaColombiaComorosCongo, Dem. Rep.Congo, Rep.Costa RicaCote d'IvoireCroatiaCubaCyprusCzech RepublicDenmarkDjiboutiDominicaDominican RepublicEarly-demographic dividendEast Asia & PacificEast Asia & Pacific (excluding high income)East Asia & Pacific (IDA & IBRD countries)EcuadorEgypt, Arab Rep.El SalvadorEquatorial GuineaEritreaEstoniaEthiopiaEuro areaEurope & Central AsiaEurope & Central Asia (excluding high income)Europe & Central Asia (IDA & IBRD countries)European UnionFijiFinlandFragile and conflict affected situationsFranceGabonGambia, TheGeorgiaGermanyGhanaGreeceGreenlandGrenadaGuatemalaGuineaGuinea-BissauGuyanaHaitiHeavily indebted poor countries (HIPC)High incomeHondurasHong Kong SAR, ChinaHungaryIBRD onlyIcelandIDA & IBRD totalIDA blendIDA onlyIDA totalIndiaIndonesiaIran, Islamic Rep.IraqIrelandIsraelItalyJamaicaJapanJordanKazakhstanKenyaKiribatiKorea, Rep.KosovoKuwaitKyrgyz RepublicLao PDRLate-demographic dividendLatin America & Caribbean Latin America & Caribbean (excluding high income)Latin America & the Caribbean (IDA & IBRD countries)LatviaLeast developed countries: UN classificationLebanonLesothoLiberiaLibyaLiechtensteinLithuaniaLow & middle incomeLow incomeLower middle incomeLuxembourgMacao SAR, ChinaMacedonia, FYRMadagascarMalawiMalaysiaMaldivesMaliMaltaMarshall IslandsMauritaniaMauritiusMexicoMicronesia, Fed. Sts.Middle East & North AfricaMiddle East & North Africa (excluding high income)Middle East & North Africa (IDA & IBRD countries)Middle incomeMoldovaMonacoMongoliaMontenegroMoroccoMozambiqueMyanmarNamibiaNepalNetherlandsNew ZealandNicaraguaNigerNigeriaNorth AmericaNorwayOECD membersOmanOther small statesPacific island small statesPakistanPalauPanamaPapua New GuineaParaguayPeruPhilippinesPolandPortugalPost-demographic dividendPre-demographic dividendPuerto RicoQatarRomaniaRussian FederationRwandaSamoaSan MarinoSao Tome and PrincipeSaudi ArabiaSenegalSerbiaSeychellesSierra LeoneSingaporeSlovak RepublicSloveniaSmall statesSolomon IslandsSouth AfricaSouth AsiaSouth Asia (IDA & IBRD)SpainSri LankaSt. Kitts and NevisSt. LuciaSt. Vincent and the GrenadinesSub-Saharan Africa Sub-Saharan Africa (excluding high income)Sub-Saharan Africa (IDA & IBRD countries)SudanSurinameSwazilandSwedenSwitzerlandSyrian Arab RepublicTajikistanTanzaniaThailandTimor-LesteTogoTongaTrinidad and TobagoTunisiaTurkeyTurkmenistanTuvaluUgandaUkraineUnited Arab EmiratesUnited KingdomUnited StatesUpper middle incomeUruguayUzbekistanVanuatuVenezuela, RBVietnamWest Bank and GazaWorldYemen, Rep.ZambiaZimbabwe Linha do tempo:
Nesta escala de tempo está apresentado um gráfico de 1971 ano até 2014 ano Andorra. Dados de 1970 ano ausente. O número de observações reais por data: 44.
Fonte (nome):
Indicadores de desenvolvimento mundial
Fonte (organização):
World Bank staff estimates using data from the United Nations Statistics Division's National Accounts Statistics.
Categorias:
Economy & Growth, Environment
Foi atualizado:
23 abr 2017 ano
Indicadores de alterações dos valores ao longo dos anos
Mínimo:
7.53
1 jan 1972 ano
Máximo:
10.588
1 jan 2011 ano
Na data de observação
Valor
Mudança absoluta
A alteração em relação ao valor anterior
1 jan 1971 ano
7.536
+7.536
0.0%
1 jan 1972 ano
7.53
-0.006
-0.07%
1 jan 1973 ano
7.556
+0.026
0.34%
1 jan 1974 ano
7.581
+0.025
0.33%
1 jan 1975 ano
7.591
+0.01
0.13%
1 jan 1976 ano
8.082
+0.491
6.47%
1 jan 1977 ano
8.08
-0.002
-0.02%
1 jan 1978 ano
8.078
-0.003
-0.03%
1 jan 1979 ano
8.063
-0.015
-0.18%
1 jan 1980 ano
8.032
-0.031
-0.38%
1 jan 1981 ano
9.066
+1.034
12.88%
1 jan 1982 ano
9.022
-0.044
-0.49%
1 jan 1983 ano
8.99
-0.032
-0.36%
1 jan 1984 ano
8.961
-0.029
-0.32%
1 jan 1985 ano
8.933
-0.029
-0.32%
1 jan 1986 ano
9.71
+0.777
8.7%
1 jan 1987 ano
9.698
-0.012
-0.12%
1 jan 1988 ano
9.714
+0.016
0.16%
1 jan 1989 ano
9.724
+0.011
0.11%
1 jan 1990 ano
9.733
+0.009
0.09%
1 jan 1991 ano
9.85
+0.117
1.2%
1 jan 1992 ano
9.833
-0.018
-0.18%
1 jan 1993 ano
9.801
-0.031
-0.32%
1 jan 1994 ano
9.741
-0.06
-0.62%
1 jan 1995 ano
9.737
-0.004
-0.04%
1 jan 1996 ano
10.002
+0.265
2.72%
1 jan 1997 ano
10.03
+0.028
0.28%
1 jan 1998 ano
10.164
+0.135
1.34%
1 jan 1999 ano
10.15
-0.014
-0.14%
1 jan 2000 ano
10.231
+0.081
0.8%
1 jan 2001 ano
10.023
-0.208
-2.03%
1 jan 2002 ano
10.189
+0.165
1.65%
1 jan 2003 ano
10.318
+0.129
1.27%
1 jan 2004 ano
10.458
+0.14
1.36%
1 jan 2005 ano
10.55
+0.093
0.89%
1 jan 2006 ano
10.425
-0.126
-1.19%
1 jan 2007 ano
10.424
-0.001
-0.01%
1 jan 2008 ano
10.379
-0.044
-0.42%
1 jan 2009 ano
10.271
-0.108
-1.04%
1 jan 2010 ano
10.093
-0.178
-1.73%
1 jan 2011 ano
10.588
+0.495
4.9%
1 jan 2012 ano
10.5
-0.089
-0.84%
1 jan 2013 ano
10.318
-0.182
-1.73%
1 jan 2014 ano
10.201
-0.116
-1.13%
Classificação de países por estatísticas atuais por anos


Comentários: