29
/pt/
pt
AIzaSyAYiBZKx7MnpbEhh9jyipgxe19OcubqV5w
April 1, 2024
181800
Luxembourg
LUX
true
2
1
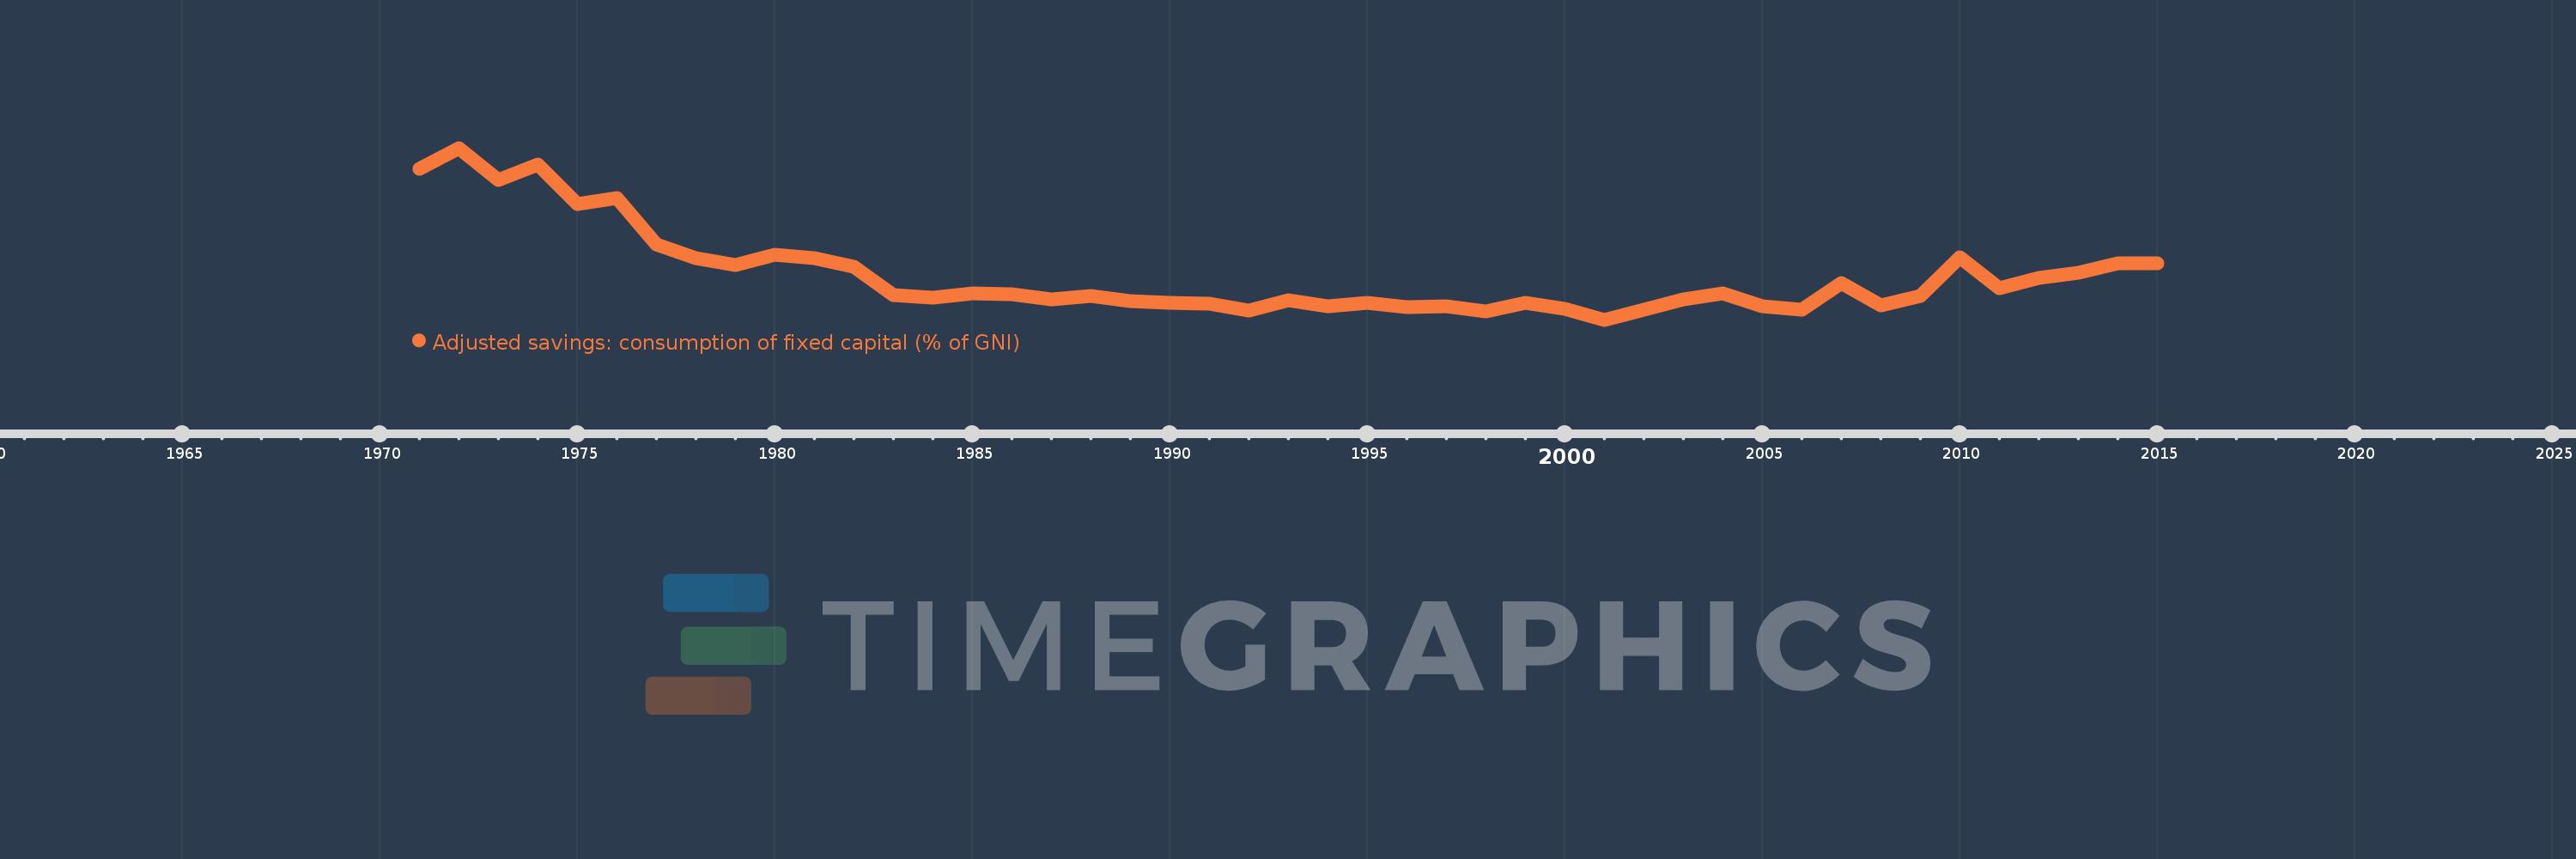
Adjusted savings: consumption of fixed capital (% of GNI)
2015,2014,2013,2012,2011,2010,2009,2008,2007,2006,2005,2004,2003,2002,2001,2000,1999,1998,1997,1996,1995,1994,1993,1992,1991,1990,1989,1988,1987,1986,1985,1984,1983,1982,1981,1980,1979,1978,1977,1976,1975,1974,1973,1972,1971
Estas estatísticas em outros países:
AfghanistanAlbaniaAlgeriaAndorraAngolaAntigua and BarbudaArab WorldArgentinaArmeniaAustraliaAustriaAzerbaijanBahamas, TheBahrainBangladeshBarbadosBelarusBelgiumBelizeBeninBermudaBhutanBoliviaBosnia and HerzegovinaBotswanaBrazilBrunei DarussalamBulgariaBurkina FasoBurundiCabo VerdeCambodiaCameroonCanadaCaribbean small statesCentral African RepublicCentral Europe and the BalticsChadChileChinaColombiaComorosCongo, Dem. Rep.Congo, Rep.Costa RicaCote d'IvoireCroatiaCubaCyprusCzech RepublicDenmarkDjiboutiDominicaDominican RepublicEarly-demographic dividendEast Asia & PacificEast Asia & Pacific (excluding high income)East Asia & Pacific (IDA & IBRD countries)EcuadorEgypt, Arab Rep.El SalvadorEquatorial GuineaEritreaEstoniaEthiopiaEuro areaEurope & Central AsiaEurope & Central Asia (excluding high income)Europe & Central Asia (IDA & IBRD countries)European UnionFijiFinlandFragile and conflict affected situationsFranceGabonGambia, TheGeorgiaGermanyGhanaGreeceGreenlandGrenadaGuatemalaGuineaGuinea-BissauGuyanaHaitiHeavily indebted poor countries (HIPC)High incomeHondurasHong Kong SAR, ChinaHungaryIBRD onlyIcelandIDA & IBRD totalIDA blendIDA onlyIDA totalIndiaIndonesiaIran, Islamic Rep.IraqIrelandIsraelItalyJamaicaJapanJordanKazakhstanKenyaKiribatiKorea, Rep.KosovoKuwaitKyrgyz RepublicLao PDRLate-demographic dividendLatin America & Caribbean Latin America & Caribbean (excluding high income)Latin America & the Caribbean (IDA & IBRD countries)LatviaLeast developed countries: UN classificationLebanonLesothoLiberiaLibyaLiechtensteinLithuaniaLow & middle incomeLow incomeLower middle incomeLuxembourgMacao SAR, ChinaMacedonia, FYRMadagascarMalawiMalaysiaMaldivesMaliMaltaMarshall IslandsMauritaniaMauritiusMexicoMicronesia, Fed. Sts.Middle East & North AfricaMiddle East & North Africa (excluding high income)Middle East & North Africa (IDA & IBRD countries)Middle incomeMoldovaMonacoMongoliaMontenegroMoroccoMozambiqueMyanmarNamibiaNepalNetherlandsNew ZealandNicaraguaNigerNigeriaNorth AmericaNorwayOECD membersOmanOther small statesPacific island small statesPakistanPalauPanamaPapua New GuineaParaguayPeruPhilippinesPolandPortugalPost-demographic dividendPre-demographic dividendPuerto RicoQatarRomaniaRussian FederationRwandaSamoaSan MarinoSao Tome and PrincipeSaudi ArabiaSenegalSerbiaSeychellesSierra LeoneSingaporeSlovak RepublicSloveniaSmall statesSolomon IslandsSouth AfricaSouth AsiaSouth Asia (IDA & IBRD)SpainSri LankaSt. Kitts and NevisSt. LuciaSt. Vincent and the GrenadinesSub-Saharan Africa Sub-Saharan Africa (excluding high income)Sub-Saharan Africa (IDA & IBRD countries)SudanSurinameSwazilandSwedenSwitzerlandSyrian Arab RepublicTajikistanTanzaniaThailandTimor-LesteTogoTongaTrinidad and TobagoTunisiaTurkeyTurkmenistanTuvaluUgandaUkraineUnited Arab EmiratesUnited KingdomUnited StatesUpper middle incomeUruguayUzbekistanVanuatuVenezuela, RBVietnamWest Bank and GazaWorldYemen, Rep.ZambiaZimbabwe Linha do tempo:
Nesta escala de tempo está apresentado um gráfico de 1971 ano até 2015 ano Luxembourg. Dados de 1970 ano ausente. O número de observações reais por data: 45.
Fonte (nome):
Indicadores de desenvolvimento mundial
Fonte (organização):
World Bank staff estimates using data from the United Nations Statistics Division's National Accounts Statistics.
Categorias:
Economy & Growth, Environment
Foi atualizado:
23 abr 2017 ano
Indicadores de alterações dos valores ao longo dos anos
Mínimo:
14.73
1 jan 2001 ano
Máximo:
30.126
1 jan 1972 ano
Na data de observação
Valor
Mudança absoluta
A alteração em relação ao valor anterior
1 jan 1971 ano
28.26
+28.26
0.0%
1 jan 1972 ano
30.126
+1.867
6.61%
1 jan 1973 ano
27.267
-2.859
-9.49%
1 jan 1974 ano
28.635
+1.368
5.02%
1 jan 1975 ano
25.066
-3.568
-12.46%
1 jan 1976 ano
25.67
+0.603
2.41%
1 jan 1977 ano
21.488
-4.181
-16.29%
1 jan 1978 ano
20.227
-1.261
-5.87%
1 jan 1979 ano
19.639
-0.588
-2.91%
1 jan 1980 ano
20.568
+0.93
4.73%
1 jan 1981 ano
20.253
-0.316
-1.53%
1 jan 1982 ano
19.476
-0.777
-3.83%
1 jan 1983 ano
16.965
-2.511
-12.89%
1 jan 1984 ano
16.734
-0.232
-1.37%
1 jan 1985 ano
17.119
+0.385
2.3%
1 jan 1986 ano
17.003
-0.115
-0.67%
1 jan 1987 ano
16.532
-0.472
-2.77%
1 jan 1988 ano
16.881
+0.35
2.12%
1 jan 1989 ano
16.429
-0.452
-2.68%
1 jan 1990 ano
16.237
-0.192
-1.17%
1 jan 1991 ano
16.166
-0.072
-0.44%
1 jan 1992 ano
15.556
-0.609
-3.77%
1 jan 1993 ano
16.446
+0.89
5.72%
1 jan 1994 ano
15.917
-0.53
-3.22%
1 jan 1995 ano
16.275
+0.359
2.25%
1 jan 1996 ano
15.875
-0.401
-2.46%
1 jan 1997 ano
15.977
+0.103
0.65%
1 jan 1998 ano
15.475
-0.503
-3.15%
1 jan 1999 ano
16.249
+0.774
5.0%
1 jan 2000 ano
15.714
-0.535
-3.29%
1 jan 2001 ano
14.73
-0.984
-6.26%
1 jan 2002 ano
15.66
+0.93
6.31%
1 jan 2003 ano
16.518
+0.858
5.48%
1 jan 2004 ano
17.073
+0.554
3.35%
1 jan 2005 ano
15.963
-1.11
-6.5%
1 jan 2006 ano
15.668
-0.295
-1.85%
1 jan 2007 ano
17.997
+2.329
14.87%
1 jan 2008 ano
16.023
-1.974
-10.97%
1 jan 2009 ano
16.895
+0.873
5.45%
1 jan 2010 ano
20.324
+3.428
20.29%
1 jan 2011 ano
17.526
-2.797
-13.76%
1 jan 2012 ano
18.492
+0.966
5.51%
1 jan 2013 ano
18.908
+0.416
2.25%
1 jan 2014 ano
19.776
+0.868
4.59%
1 jan 2015 ano
19.776
+0.001
0.0%
Classificação de países por estatísticas atuais por anos


Comentários: