29
/pt/
pt
AIzaSyAYiBZKx7MnpbEhh9jyipgxe19OcubqV5w
April 1, 2024
142477
Greenland
GRL
true
2
1
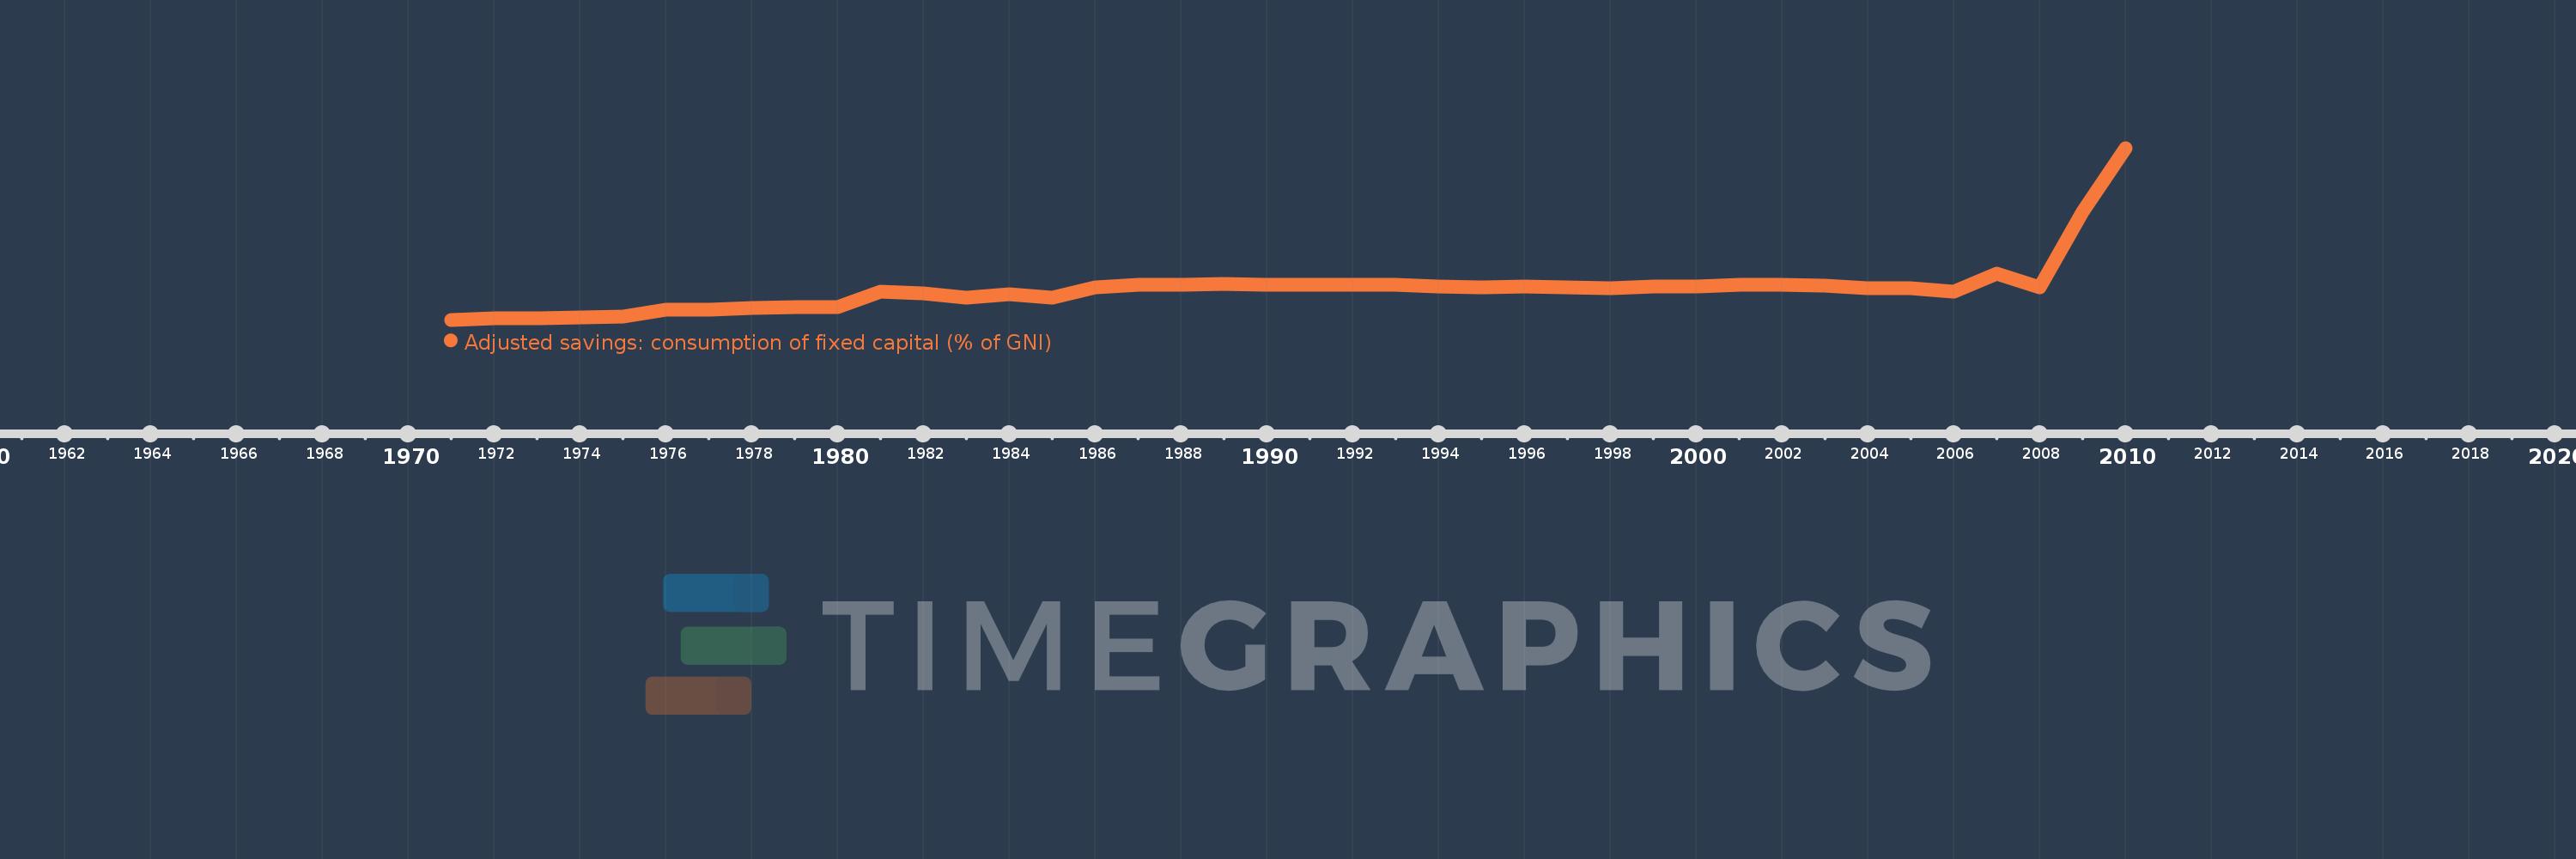
Adjusted savings: consumption of fixed capital (% of GNI)
2010,2009,2008,2007,2006,2005,2004,2003,2002,2001,2000,1999,1998,1997,1996,1995,1994,1993,1992,1991,1990,1989,1988,1987,1986,1985,1984,1983,1982,1981,1980,1979,1978,1977,1976,1975,1974,1973,1972,1971
Estas estatísticas em outros países:
AfghanistanAlbaniaAlgeriaAndorraAngolaAntigua and BarbudaArab WorldArgentinaArmeniaAustraliaAustriaAzerbaijanBahamas, TheBahrainBangladeshBarbadosBelarusBelgiumBelizeBeninBermudaBhutanBoliviaBosnia and HerzegovinaBotswanaBrazilBrunei DarussalamBulgariaBurkina FasoBurundiCabo VerdeCambodiaCameroonCanadaCaribbean small statesCentral African RepublicCentral Europe and the BalticsChadChileChinaColombiaComorosCongo, Dem. Rep.Congo, Rep.Costa RicaCote d'IvoireCroatiaCubaCyprusCzech RepublicDenmarkDjiboutiDominicaDominican RepublicEarly-demographic dividendEast Asia & PacificEast Asia & Pacific (excluding high income)East Asia & Pacific (IDA & IBRD countries)EcuadorEgypt, Arab Rep.El SalvadorEquatorial GuineaEritreaEstoniaEthiopiaEuro areaEurope & Central AsiaEurope & Central Asia (excluding high income)Europe & Central Asia (IDA & IBRD countries)European UnionFijiFinlandFragile and conflict affected situationsFranceGabonGambia, TheGeorgiaGermanyGhanaGreeceGreenlandGrenadaGuatemalaGuineaGuinea-BissauGuyanaHaitiHeavily indebted poor countries (HIPC)High incomeHondurasHong Kong SAR, ChinaHungaryIBRD onlyIcelandIDA & IBRD totalIDA blendIDA onlyIDA totalIndiaIndonesiaIran, Islamic Rep.IraqIrelandIsraelItalyJamaicaJapanJordanKazakhstanKenyaKiribatiKorea, Rep.KosovoKuwaitKyrgyz RepublicLao PDRLate-demographic dividendLatin America & Caribbean Latin America & Caribbean (excluding high income)Latin America & the Caribbean (IDA & IBRD countries)LatviaLeast developed countries: UN classificationLebanonLesothoLiberiaLibyaLiechtensteinLithuaniaLow & middle incomeLow incomeLower middle incomeLuxembourgMacao SAR, ChinaMacedonia, FYRMadagascarMalawiMalaysiaMaldivesMaliMaltaMarshall IslandsMauritaniaMauritiusMexicoMicronesia, Fed. Sts.Middle East & North AfricaMiddle East & North Africa (excluding high income)Middle East & North Africa (IDA & IBRD countries)Middle incomeMoldovaMonacoMongoliaMontenegroMoroccoMozambiqueMyanmarNamibiaNepalNetherlandsNew ZealandNicaraguaNigerNigeriaNorth AmericaNorwayOECD membersOmanOther small statesPacific island small statesPakistanPalauPanamaPapua New GuineaParaguayPeruPhilippinesPolandPortugalPost-demographic dividendPre-demographic dividendPuerto RicoQatarRomaniaRussian FederationRwandaSamoaSan MarinoSao Tome and PrincipeSaudi ArabiaSenegalSerbiaSeychellesSierra LeoneSingaporeSlovak RepublicSloveniaSmall statesSolomon IslandsSouth AfricaSouth AsiaSouth Asia (IDA & IBRD)SpainSri LankaSt. Kitts and NevisSt. LuciaSt. Vincent and the GrenadinesSub-Saharan Africa Sub-Saharan Africa (excluding high income)Sub-Saharan Africa (IDA & IBRD countries)SudanSurinameSwazilandSwedenSwitzerlandSyrian Arab RepublicTajikistanTanzaniaThailandTimor-LesteTogoTongaTrinidad and TobagoTunisiaTurkeyTurkmenistanTuvaluUgandaUkraineUnited Arab EmiratesUnited KingdomUnited StatesUpper middle incomeUruguayUzbekistanVanuatuVenezuela, RBVietnamWest Bank and GazaWorldYemen, Rep.ZambiaZimbabwe Linha do tempo:
Nesta escala de tempo está apresentado um gráfico de 1971 ano até 2010 ano Greenland. Dados de 1970 ano ausente. O número de observações reais por data: 40.
Fonte (nome):
Indicadores de desenvolvimento mundial
Fonte (organização):
World Bank staff estimates using data from the United Nations Statistics Division's National Accounts Statistics.
Categorias:
Economy & Growth, Environment
Foi atualizado:
23 abr 2017 ano
Indicadores de alterações dos valores ao longo dos anos
Mínimo:
8.79
1 jan 1971 ano
Máximo:
22.917
1 jan 2010 ano
Na data de observação
Valor
Mudança absoluta
A alteração em relação ao valor anterior
1 jan 1971 ano
8.79
+8.79
0.0%
1 jan 1972 ano
8.9
+0.11
1.25%
1 jan 1973 ano
8.938
+0.038
0.43%
1 jan 1974 ano
8.992
+0.054
0.6%
1 jan 1975 ano
9.039
+0.047
0.53%
1 jan 1976 ano
9.586
+0.546
6.04%
1 jan 1977 ano
9.647
+0.061
0.64%
1 jan 1978 ano
9.746
+0.1
1.03%
1 jan 1979 ano
9.815
+0.069
0.7%
1 jan 1980 ano
9.858
+0.043
0.44%
1 jan 1981 ano
11.079
+1.221
12.38%
1 jan 1982 ano
10.977
-0.102
-0.92%
1 jan 1983 ano
10.615
-0.363
-3.3%
1 jan 1984 ano
10.891
+0.276
2.6%
1 jan 1985 ano
10.636
-0.255
-2.34%
1 jan 1986 ano
11.45
+0.813
7.65%
1 jan 1987 ano
11.697
+0.247
2.16%
1 jan 1988 ano
11.653
-0.044
-0.37%
1 jan 1989 ano
11.707
+0.054
0.46%
1 jan 1990 ano
11.674
-0.033
-0.28%
1 jan 1991 ano
11.699
+0.025
0.22%
1 jan 1992 ano
11.672
-0.027
-0.23%
1 jan 1993 ano
11.643
-0.028
-0.24%
1 jan 1994 ano
11.516
-0.127
-1.09%
1 jan 1995 ano
11.431
-0.086
-0.74%
1 jan 1996 ano
11.555
+0.124
1.08%
1 jan 1997 ano
11.438
-0.117
-1.01%
1 jan 1998 ano
11.415
-0.023
-0.2%
1 jan 1999 ano
11.522
+0.108
0.94%
1 jan 2000 ano
11.54
+0.017
0.15%
1 jan 2001 ano
11.647
+0.108
0.93%
1 jan 2002 ano
11.664
+0.016
0.14%
1 jan 2003 ano
11.629
-0.035
-0.3%
1 jan 2004 ano
11.369
-0.26
-2.24%
1 jan 2005 ano
11.368
-0.001
-0.01%
1 jan 2006 ano
11.088
-0.28
-2.46%
1 jan 2007 ano
12.575
+1.487
13.41%
1 jan 2008 ano
11.426
-1.149
-9.14%
1 jan 2009 ano
17.651
+6.226
54.49%
1 jan 2010 ano
22.917
+5.265
29.83%
Classificação de países por estatísticas atuais por anos


Comentários: