29
/pt/
pt
AIzaSyAYiBZKx7MnpbEhh9jyipgxe19OcubqV5w
April 1, 2024
163468
Japan
JPN
true
2
1
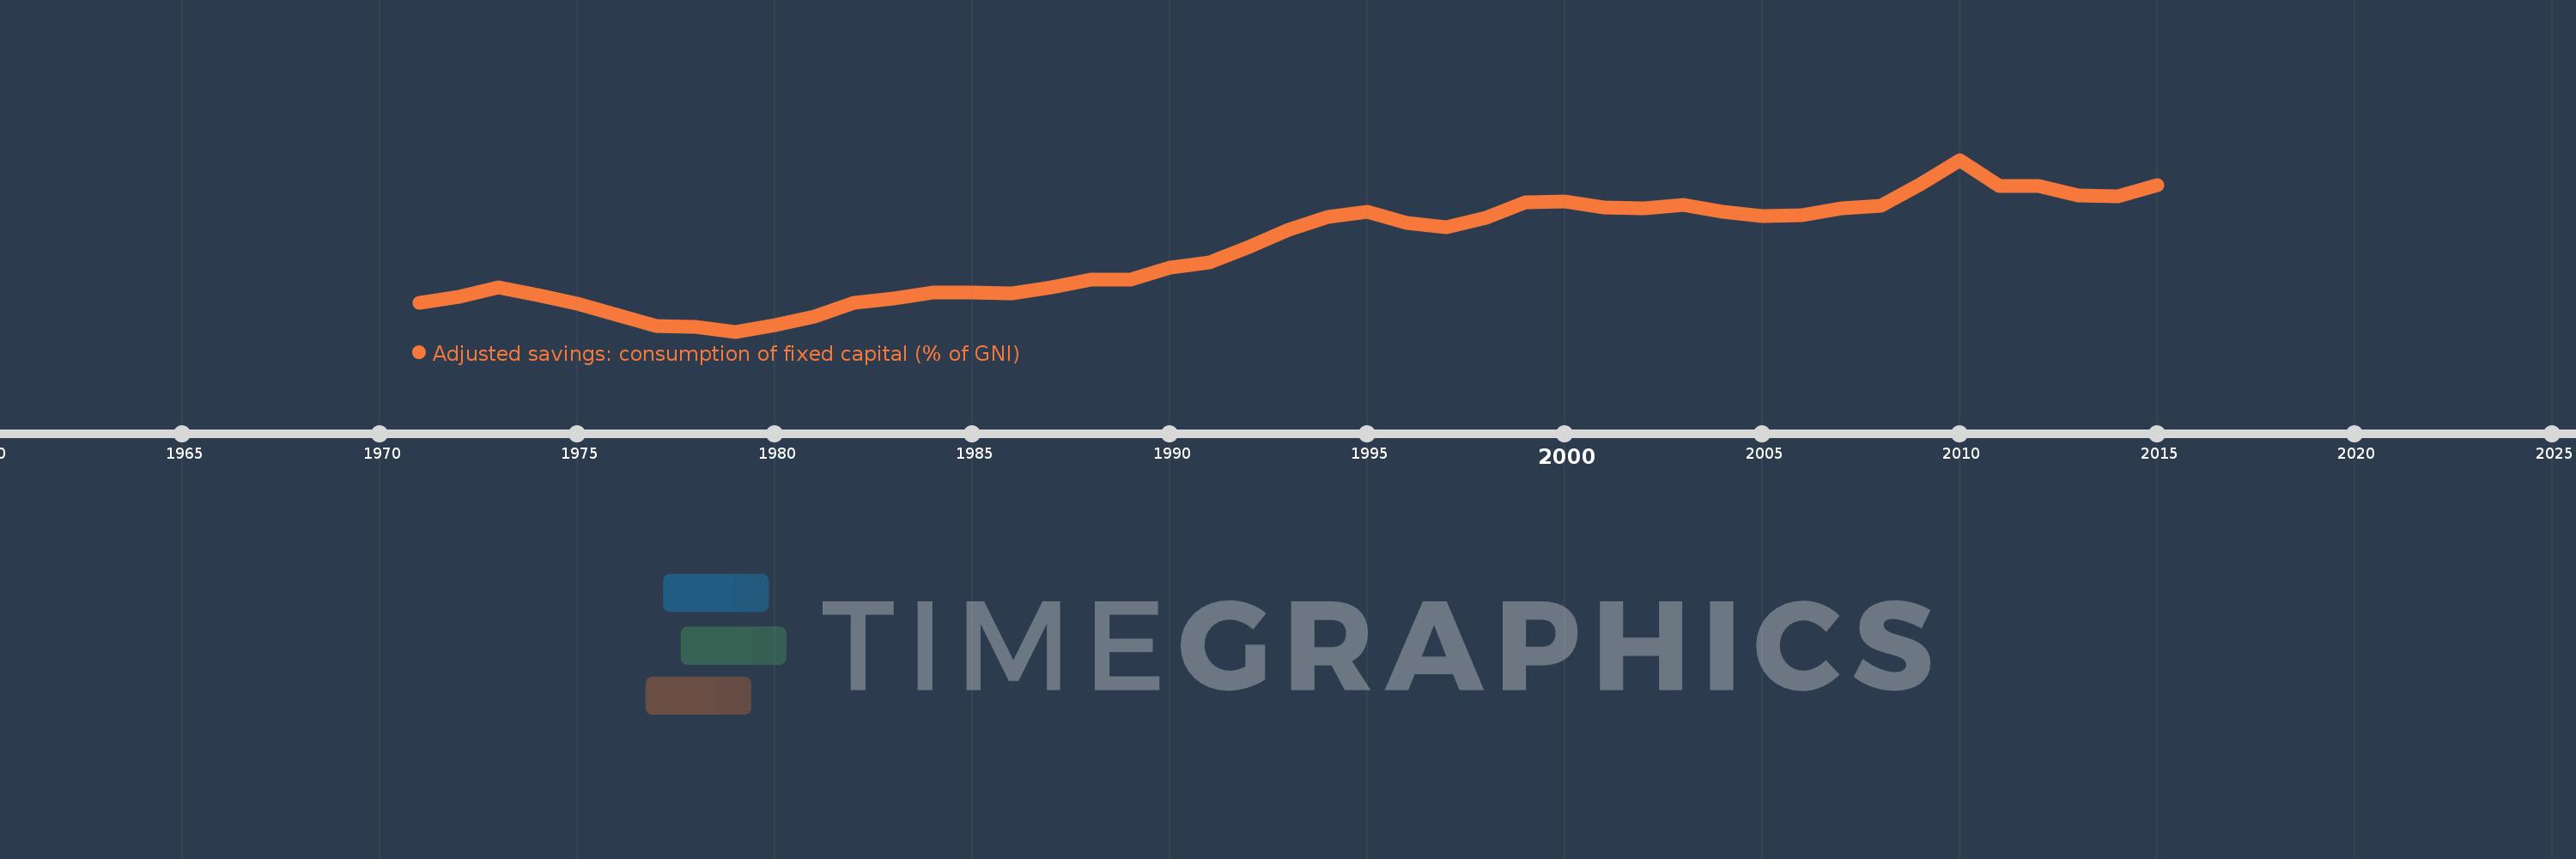
Adjusted savings: consumption of fixed capital (% of GNI)
2015,2014,2013,2012,2011,2010,2009,2008,2007,2006,2005,2004,2003,2002,2001,2000,1999,1998,1997,1996,1995,1994,1993,1992,1991,1990,1989,1988,1987,1986,1985,1984,1983,1982,1981,1980,1979,1978,1977,1976,1975,1974,1973,1972,1971
Estas estatísticas em outros países:
AfghanistanAlbaniaAlgeriaAndorraAngolaAntigua and BarbudaArab WorldArgentinaArmeniaAustraliaAustriaAzerbaijanBahamas, TheBahrainBangladeshBarbadosBelarusBelgiumBelizeBeninBermudaBhutanBoliviaBosnia and HerzegovinaBotswanaBrazilBrunei DarussalamBulgariaBurkina FasoBurundiCabo VerdeCambodiaCameroonCanadaCaribbean small statesCentral African RepublicCentral Europe and the BalticsChadChileChinaColombiaComorosCongo, Dem. Rep.Congo, Rep.Costa RicaCote d'IvoireCroatiaCubaCyprusCzech RepublicDenmarkDjiboutiDominicaDominican RepublicEarly-demographic dividendEast Asia & PacificEast Asia & Pacific (excluding high income)East Asia & Pacific (IDA & IBRD countries)EcuadorEgypt, Arab Rep.El SalvadorEquatorial GuineaEritreaEstoniaEthiopiaEuro areaEurope & Central AsiaEurope & Central Asia (excluding high income)Europe & Central Asia (IDA & IBRD countries)European UnionFijiFinlandFragile and conflict affected situationsFranceGabonGambia, TheGeorgiaGermanyGhanaGreeceGreenlandGrenadaGuatemalaGuineaGuinea-BissauGuyanaHaitiHeavily indebted poor countries (HIPC)High incomeHondurasHong Kong SAR, ChinaHungaryIBRD onlyIcelandIDA & IBRD totalIDA blendIDA onlyIDA totalIndiaIndonesiaIran, Islamic Rep.IraqIrelandIsraelItalyJamaicaJapanJordanKazakhstanKenyaKiribatiKorea, Rep.KosovoKuwaitKyrgyz RepublicLao PDRLate-demographic dividendLatin America & Caribbean Latin America & Caribbean (excluding high income)Latin America & the Caribbean (IDA & IBRD countries)LatviaLeast developed countries: UN classificationLebanonLesothoLiberiaLibyaLiechtensteinLithuaniaLow & middle incomeLow incomeLower middle incomeLuxembourgMacao SAR, ChinaMacedonia, FYRMadagascarMalawiMalaysiaMaldivesMaliMaltaMarshall IslandsMauritaniaMauritiusMexicoMicronesia, Fed. Sts.Middle East & North AfricaMiddle East & North Africa (excluding high income)Middle East & North Africa (IDA & IBRD countries)Middle incomeMoldovaMonacoMongoliaMontenegroMoroccoMozambiqueMyanmarNamibiaNepalNetherlandsNew ZealandNicaraguaNigerNigeriaNorth AmericaNorwayOECD membersOmanOther small statesPacific island small statesPakistanPalauPanamaPapua New GuineaParaguayPeruPhilippinesPolandPortugalPost-demographic dividendPre-demographic dividendPuerto RicoQatarRomaniaRussian FederationRwandaSamoaSan MarinoSao Tome and PrincipeSaudi ArabiaSenegalSerbiaSeychellesSierra LeoneSingaporeSlovak RepublicSloveniaSmall statesSolomon IslandsSouth AfricaSouth AsiaSouth Asia (IDA & IBRD)SpainSri LankaSt. Kitts and NevisSt. LuciaSt. Vincent and the GrenadinesSub-Saharan Africa Sub-Saharan Africa (excluding high income)Sub-Saharan Africa (IDA & IBRD countries)SudanSurinameSwazilandSwedenSwitzerlandSyrian Arab RepublicTajikistanTanzaniaThailandTimor-LesteTogoTongaTrinidad and TobagoTunisiaTurkeyTurkmenistanTuvaluUgandaUkraineUnited Arab EmiratesUnited KingdomUnited StatesUpper middle incomeUruguayUzbekistanVanuatuVenezuela, RBVietnamWest Bank and GazaWorldYemen, Rep.ZambiaZimbabwe Linha do tempo:
Nesta escala de tempo está apresentado um gráfico de 1971 ano até 2015 ano Japan. Dados de 1970 ano ausente. O número de observações reais por data: 45.
Fonte (nome):
Indicadores de desenvolvimento mundial
Fonte (organização):
World Bank staff estimates using data from the United Nations Statistics Division's National Accounts Statistics.
Categorias:
Economy & Growth, Environment
Foi atualizado:
23 abr 2017 ano
Indicadores de alterações dos valores ao longo dos anos
Mínimo:
14.471
1 jan 1979 ano
Máximo:
22.103
1 jan 2010 ano
Na data de observação
Valor
Mudança absoluta
A alteração em relação ao valor anterior
1 jan 1971 ano
15.735
+15.735
0.0%
1 jan 1972 ano
16.025
+0.289
1.84%
1 jan 1973 ano
16.428
+0.403
2.52%
1 jan 1974 ano
16.091
-0.338
-2.05%
1 jan 1975 ano
15.693
-0.397
-2.47%
1 jan 1976 ano
15.198
-0.495
-3.16%
1 jan 1977 ano
14.726
-0.472
-3.11%
1 jan 1978 ano
14.681
-0.045
-0.3%
1 jan 1979 ano
14.471
-0.21
-1.43%
1 jan 1980 ano
14.75
+0.28
1.93%
1 jan 1981 ano
15.135
+0.384
2.61%
1 jan 1982 ano
15.731
+0.596
3.94%
1 jan 1983 ano
15.932
+0.201
1.28%
1 jan 1984 ano
16.218
+0.286
1.79%
1 jan 1985 ano
16.195
-0.023
-0.14%
1 jan 1986 ano
16.163
-0.031
-0.19%
1 jan 1987 ano
16.435
+0.272
1.68%
1 jan 1988 ano
16.772
+0.337
2.05%
1 jan 1989 ano
16.774
+0.002
0.01%
1 jan 1990 ano
17.323
+0.549
3.27%
1 jan 1991 ano
17.524
+0.201
1.16%
1 jan 1992 ano
18.224
+0.7
3.99%
1 jan 1993 ano
18.994
+0.77
4.23%
1 jan 1994 ano
19.569
+0.575
3.03%
1 jan 1995 ano
19.808
+0.239
1.22%
1 jan 1996 ano
19.31
-0.498
-2.52%
1 jan 1997 ano
19.107
-0.203
-1.05%
1 jan 1998 ano
19.51
+0.403
2.11%
1 jan 1999 ano
20.202
+0.692
3.55%
1 jan 2000 ano
20.252
+0.049
0.24%
1 jan 2001 ano
19.997
-0.255
-1.26%
1 jan 2002 ano
19.965
-0.032
-0.16%
1 jan 2003 ano
20.081
+0.117
0.58%
1 jan 2004 ano
19.808
-0.273
-1.36%
1 jan 2005 ano
19.611
-0.197
-1.0%
1 jan 2006 ano
19.654
+0.043
0.22%
1 jan 2007 ano
19.945
+0.291
1.48%
1 jan 2008 ano
20.065
+0.12
0.6%
1 jan 2009 ano
21.033
+0.968
4.82%
1 jan 2010 ano
22.103
+1.07
5.09%
1 jan 2011 ano
20.95
-1.153
-5.22%
1 jan 2012 ano
20.946
-0.004
-0.02%
1 jan 2013 ano
20.527
-0.42
-2.0%
1 jan 2014 ano
20.465
-0.061
-0.3%
1 jan 2015 ano
20.987
+0.522
2.55%
Classificação de países por estatísticas atuais por anos


Comentários: