29
/pt/
pt
AIzaSyAYiBZKx7MnpbEhh9jyipgxe19OcubqV5w
April 1, 2024
46820
Lower middle income
LMC
false
2
1
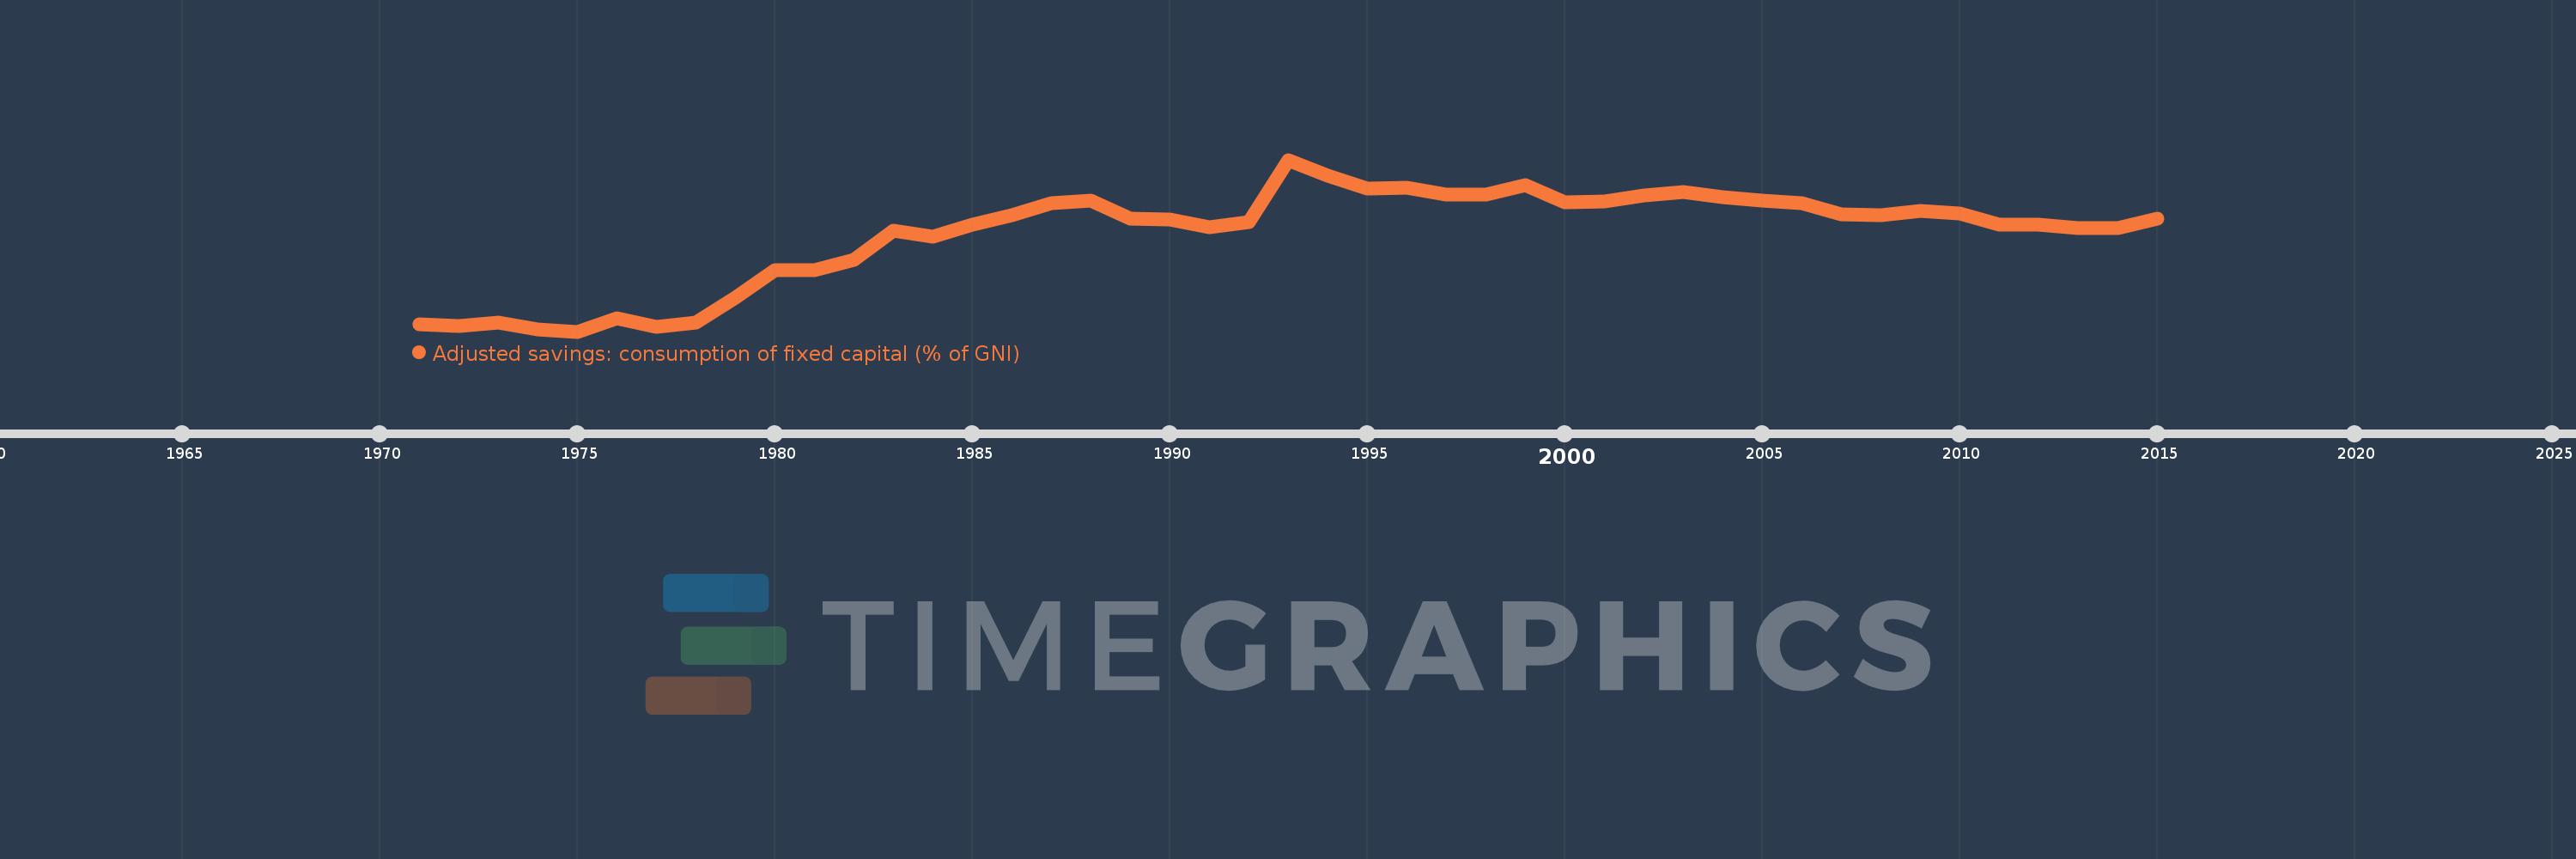
Adjusted savings: consumption of fixed capital (% of GNI)
2015,2014,2013,2012,2011,2010,2009,2008,2007,2006,2005,2004,2003,2002,2001,2000,1999,1998,1997,1996,1995,1994,1993,1992,1991,1990,1989,1988,1987,1986,1985,1984,1983,1982,1981,1980,1979,1978,1977,1976,1975,1974,1973,1972,1971
Estas estatísticas em outros países:
AfghanistanAlbaniaAlgeriaAndorraAngolaAntigua and BarbudaArab WorldArgentinaArmeniaAustraliaAustriaAzerbaijanBahamas, TheBahrainBangladeshBarbadosBelarusBelgiumBelizeBeninBermudaBhutanBoliviaBosnia and HerzegovinaBotswanaBrazilBrunei DarussalamBulgariaBurkina FasoBurundiCabo VerdeCambodiaCameroonCanadaCaribbean small statesCentral African RepublicCentral Europe and the BalticsChadChileChinaColombiaComorosCongo, Dem. Rep.Congo, Rep.Costa RicaCote d'IvoireCroatiaCubaCyprusCzech RepublicDenmarkDjiboutiDominicaDominican RepublicEarly-demographic dividendEast Asia & PacificEast Asia & Pacific (excluding high income)East Asia & Pacific (IDA & IBRD countries)EcuadorEgypt, Arab Rep.El SalvadorEquatorial GuineaEritreaEstoniaEthiopiaEuro areaEurope & Central AsiaEurope & Central Asia (excluding high income)Europe & Central Asia (IDA & IBRD countries)European UnionFijiFinlandFragile and conflict affected situationsFranceGabonGambia, TheGeorgiaGermanyGhanaGreeceGreenlandGrenadaGuatemalaGuineaGuinea-BissauGuyanaHaitiHeavily indebted poor countries (HIPC)High incomeHondurasHong Kong SAR, ChinaHungaryIBRD onlyIcelandIDA & IBRD totalIDA blendIDA onlyIDA totalIndiaIndonesiaIran, Islamic Rep.IraqIrelandIsraelItalyJamaicaJapanJordanKazakhstanKenyaKiribatiKorea, Rep.KosovoKuwaitKyrgyz RepublicLao PDRLate-demographic dividendLatin America & Caribbean Latin America & Caribbean (excluding high income)Latin America & the Caribbean (IDA & IBRD countries)LatviaLeast developed countries: UN classificationLebanonLesothoLiberiaLibyaLiechtensteinLithuaniaLow & middle incomeLow incomeLower middle incomeLuxembourgMacao SAR, ChinaMacedonia, FYRMadagascarMalawiMalaysiaMaldivesMaliMaltaMarshall IslandsMauritaniaMauritiusMexicoMicronesia, Fed. Sts.Middle East & North AfricaMiddle East & North Africa (excluding high income)Middle East & North Africa (IDA & IBRD countries)Middle incomeMoldovaMonacoMongoliaMontenegroMoroccoMozambiqueMyanmarNamibiaNepalNetherlandsNew ZealandNicaraguaNigerNigeriaNorth AmericaNorwayOECD membersOmanOther small statesPacific island small statesPakistanPalauPanamaPapua New GuineaParaguayPeruPhilippinesPolandPortugalPost-demographic dividendPre-demographic dividendPuerto RicoQatarRomaniaRussian FederationRwandaSamoaSan MarinoSao Tome and PrincipeSaudi ArabiaSenegalSerbiaSeychellesSierra LeoneSingaporeSlovak RepublicSloveniaSmall statesSolomon IslandsSouth AfricaSouth AsiaSouth Asia (IDA & IBRD)SpainSri LankaSt. Kitts and NevisSt. LuciaSt. Vincent and the GrenadinesSub-Saharan Africa Sub-Saharan Africa (excluding high income)Sub-Saharan Africa (IDA & IBRD countries)SudanSurinameSwazilandSwedenSwitzerlandSyrian Arab RepublicTajikistanTanzaniaThailandTimor-LesteTogoTongaTrinidad and TobagoTunisiaTurkeyTurkmenistanTuvaluUgandaUkraineUnited Arab EmiratesUnited KingdomUnited StatesUpper middle incomeUruguayUzbekistanVanuatuVenezuela, RBVietnamWest Bank and GazaWorldYemen, Rep.ZambiaZimbabwe Linha do tempo:
Nesta escala de tempo está apresentado um gráfico de 1971 ano até 2015 ano Lower middle income. Dados de 1970 ano ausente. O número de observações reais por data: 45.
Fonte (nome):
Indicadores de desenvolvimento mundial
Fonte (organização):
World Bank staff estimates using data from the United Nations Statistics Division's National Accounts Statistics.
Categorias:
Economy & Growth, Environment
Foi atualizado:
23 abr 2017 ano
Indicadores de alterações dos valores ao longo dos anos
Mínimo:
6.465
1 jan 1975 ano
Máximo:
9.442
1 jan 1993 ano
Na data de observação
Valor
Mudança absoluta
A alteração em relação ao valor anterior
1 jan 1971 ano
6.592
+6.592
0.0%
1 jan 1972 ano
6.558
-0.035
-0.52%
1 jan 1973 ano
6.614
+0.057
0.86%
1 jan 1974 ano
6.508
-0.106
-1.61%
1 jan 1975 ano
6.465
-0.043
-0.67%
1 jan 1976 ano
6.695
+0.23
3.56%
1 jan 1977 ano
6.553
-0.142
-2.12%
1 jan 1978 ano
6.617
+0.064
0.98%
1 jan 1979 ano
7.048
+0.431
6.52%
1 jan 1980 ano
7.531
+0.483
6.85%
1 jan 1981 ano
7.527
-0.004
-0.05%
1 jan 1982 ano
7.71
+0.183
2.43%
1 jan 1983 ano
8.221
+0.512
6.63%
1 jan 1984 ano
8.112
-0.109
-1.33%
1 jan 1985 ano
8.317
+0.204
2.52%
1 jan 1986 ano
8.48
+0.163
1.96%
1 jan 1987 ano
8.697
+0.217
2.56%
1 jan 1988 ano
8.738
+0.041
0.47%
1 jan 1989 ano
8.421
-0.317
-3.63%
1 jan 1990 ano
8.409
-0.012
-0.14%
1 jan 1991 ano
8.276
-0.133
-1.58%
1 jan 1992 ano
8.369
+0.093
1.12%
1 jan 1993 ano
9.442
+1.073
12.83%
1 jan 1994 ano
9.172
-0.271
-2.87%
1 jan 1995 ano
8.941
-0.23
-2.51%
1 jan 1996 ano
8.956
+0.015
0.17%
1 jan 1997 ano
8.841
-0.115
-1.29%
1 jan 1998 ano
8.845
+0.003
0.04%
1 jan 1999 ano
9.002
+0.157
1.78%
1 jan 2000 ano
8.706
-0.296
-3.29%
1 jan 2001 ano
8.719
+0.013
0.15%
1 jan 2002 ano
8.83
+0.111
1.28%
1 jan 2003 ano
8.89
+0.06
0.68%
1 jan 2004 ano
8.798
-0.092
-1.03%
1 jan 2005 ano
8.734
-0.064
-0.73%
1 jan 2006 ano
8.697
-0.038
-0.43%
1 jan 2007 ano
8.498
-0.199
-2.29%
1 jan 2008 ano
8.489
-0.009
-0.11%
1 jan 2009 ano
8.561
+0.072
0.85%
1 jan 2010 ano
8.512
-0.048
-0.56%
1 jan 2011 ano
8.318
-0.194
-2.28%
1 jan 2012 ano
8.323
+0.005
0.06%
1 jan 2013 ano
8.252
-0.071
-0.85%
1 jan 2014 ano
8.264
+0.012
0.15%
1 jan 2015 ano
8.427
+0.163
1.97%
Classificação de países por estatísticas atuais por anos


Comentários: