29
/pt/
pt
AIzaSyAYiBZKx7MnpbEhh9jyipgxe19OcubqV5w
April 1, 2024
42063
Latin America & Caribbean (excluding high income)
LAC
false
2
1
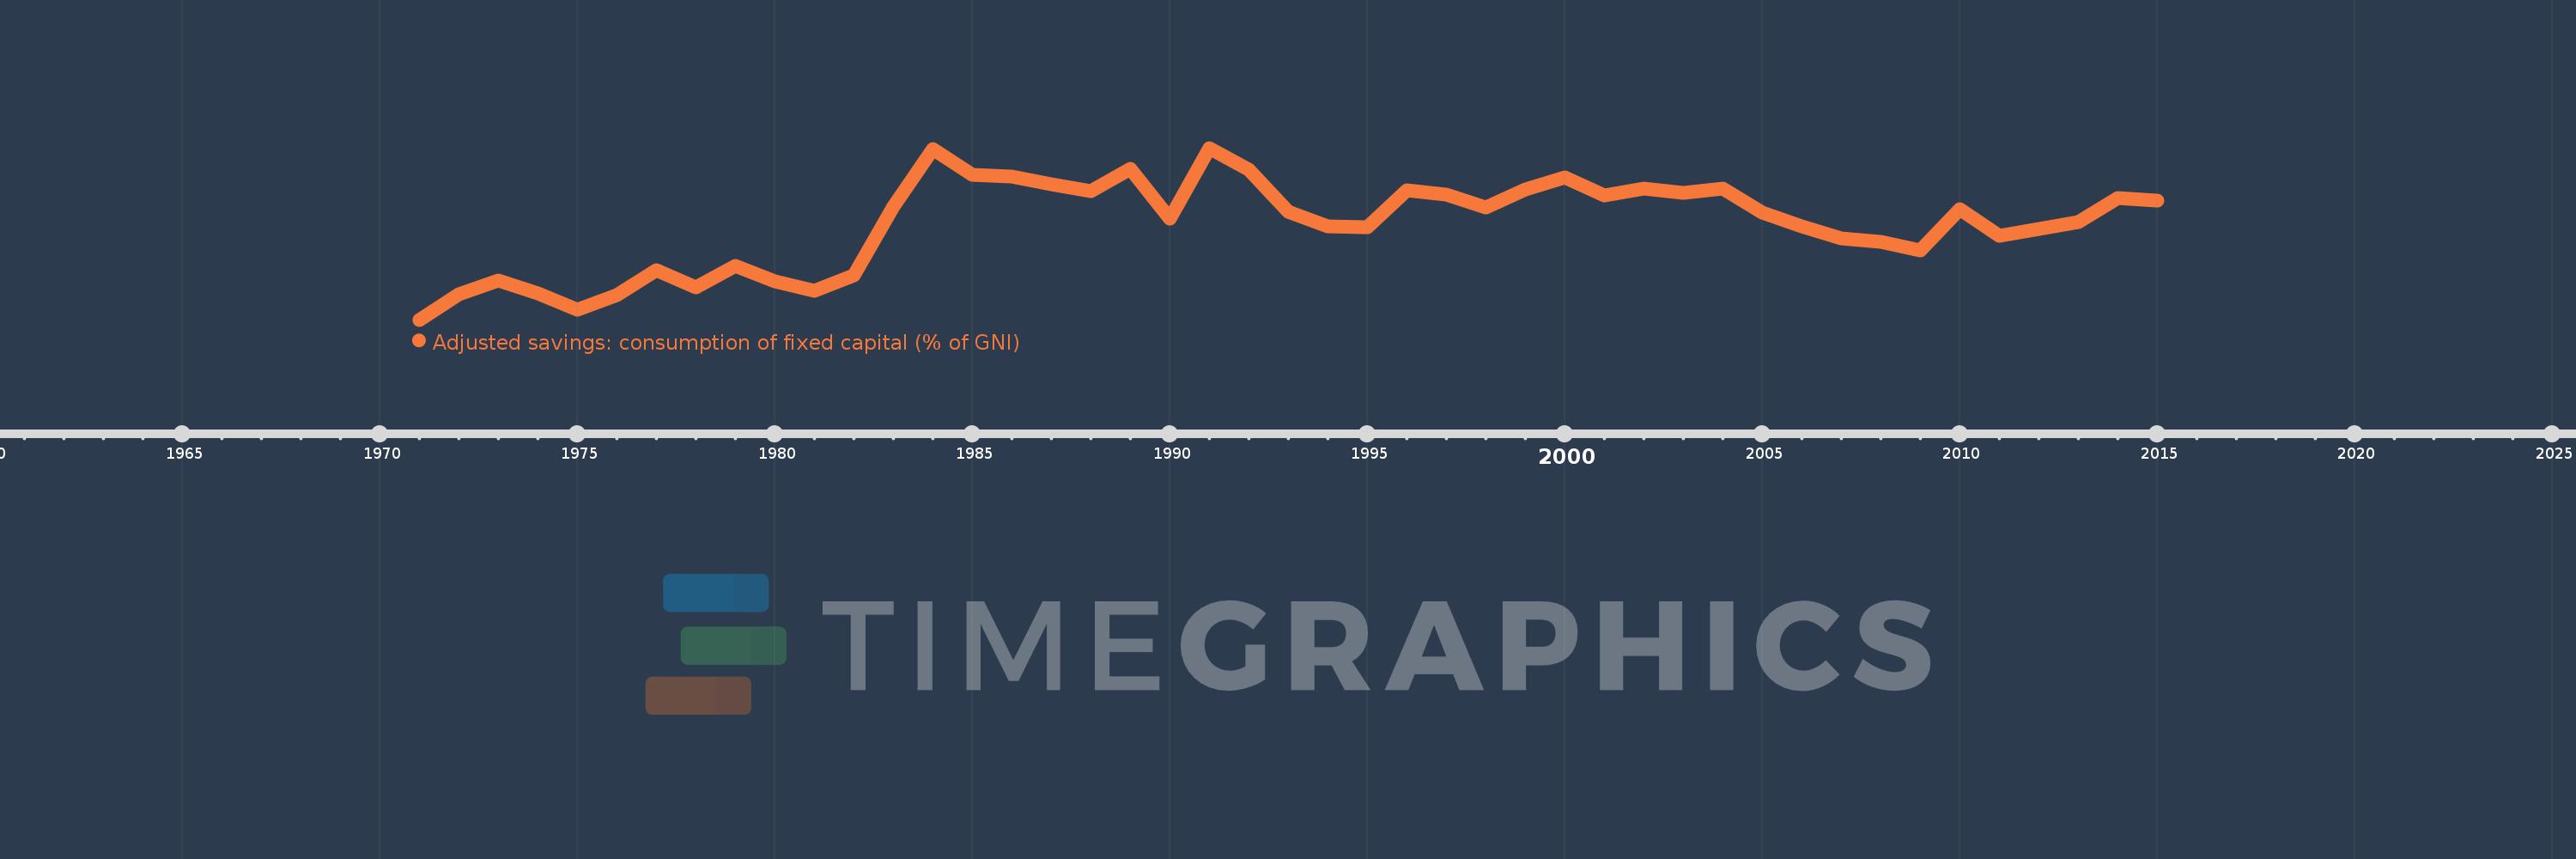
Adjusted savings: consumption of fixed capital (% of GNI)
2015,2014,2013,2012,2011,2010,2009,2008,2007,2006,2005,2004,2003,2002,2001,2000,1999,1998,1997,1996,1995,1994,1993,1992,1991,1990,1989,1988,1987,1986,1985,1984,1983,1982,1981,1980,1979,1978,1977,1976,1975,1974,1973,1972,1971
Estas estatísticas em outros países:
AfghanistanAlbaniaAlgeriaAndorraAngolaAntigua and BarbudaArab WorldArgentinaArmeniaAustraliaAustriaAzerbaijanBahamas, TheBahrainBangladeshBarbadosBelarusBelgiumBelizeBeninBermudaBhutanBoliviaBosnia and HerzegovinaBotswanaBrazilBrunei DarussalamBulgariaBurkina FasoBurundiCabo VerdeCambodiaCameroonCanadaCaribbean small statesCentral African RepublicCentral Europe and the BalticsChadChileChinaColombiaComorosCongo, Dem. Rep.Congo, Rep.Costa RicaCote d'IvoireCroatiaCubaCyprusCzech RepublicDenmarkDjiboutiDominicaDominican RepublicEarly-demographic dividendEast Asia & PacificEast Asia & Pacific (excluding high income)East Asia & Pacific (IDA & IBRD countries)EcuadorEgypt, Arab Rep.El SalvadorEquatorial GuineaEritreaEstoniaEthiopiaEuro areaEurope & Central AsiaEurope & Central Asia (excluding high income)Europe & Central Asia (IDA & IBRD countries)European UnionFijiFinlandFragile and conflict affected situationsFranceGabonGambia, TheGeorgiaGermanyGhanaGreeceGreenlandGrenadaGuatemalaGuineaGuinea-BissauGuyanaHaitiHeavily indebted poor countries (HIPC)High incomeHondurasHong Kong SAR, ChinaHungaryIBRD onlyIcelandIDA & IBRD totalIDA blendIDA onlyIDA totalIndiaIndonesiaIran, Islamic Rep.IraqIrelandIsraelItalyJamaicaJapanJordanKazakhstanKenyaKiribatiKorea, Rep.KosovoKuwaitKyrgyz RepublicLao PDRLate-demographic dividendLatin America & Caribbean Latin America & Caribbean (excluding high income)Latin America & the Caribbean (IDA & IBRD countries)LatviaLeast developed countries: UN classificationLebanonLesothoLiberiaLibyaLiechtensteinLithuaniaLow & middle incomeLow incomeLower middle incomeLuxembourgMacao SAR, ChinaMacedonia, FYRMadagascarMalawiMalaysiaMaldivesMaliMaltaMarshall IslandsMauritaniaMauritiusMexicoMicronesia, Fed. Sts.Middle East & North AfricaMiddle East & North Africa (excluding high income)Middle East & North Africa (IDA & IBRD countries)Middle incomeMoldovaMonacoMongoliaMontenegroMoroccoMozambiqueMyanmarNamibiaNepalNetherlandsNew ZealandNicaraguaNigerNigeriaNorth AmericaNorwayOECD membersOmanOther small statesPacific island small statesPakistanPalauPanamaPapua New GuineaParaguayPeruPhilippinesPolandPortugalPost-demographic dividendPre-demographic dividendPuerto RicoQatarRomaniaRussian FederationRwandaSamoaSan MarinoSao Tome and PrincipeSaudi ArabiaSenegalSerbiaSeychellesSierra LeoneSingaporeSlovak RepublicSloveniaSmall statesSolomon IslandsSouth AfricaSouth AsiaSouth Asia (IDA & IBRD)SpainSri LankaSt. Kitts and NevisSt. LuciaSt. Vincent and the GrenadinesSub-Saharan Africa Sub-Saharan Africa (excluding high income)Sub-Saharan Africa (IDA & IBRD countries)SudanSurinameSwazilandSwedenSwitzerlandSyrian Arab RepublicTajikistanTanzaniaThailandTimor-LesteTogoTongaTrinidad and TobagoTunisiaTurkeyTurkmenistanTuvaluUgandaUkraineUnited Arab EmiratesUnited KingdomUnited StatesUpper middle incomeUruguayUzbekistanVanuatuVenezuela, RBVietnamWest Bank and GazaWorldYemen, Rep.ZambiaZimbabwe Linha do tempo:
Nesta escala de tempo está apresentado um gráfico de 1971 ano até 2015 ano Latin America & Caribbean (excluding high income). Dados de 1970 ano ausente. O número de observações reais por data: 45.
Fonte (nome):
Indicadores de desenvolvimento mundial
Fonte (organização):
World Bank staff estimates using data from the United Nations Statistics Division's National Accounts Statistics.
Categorias:
Economy & Growth, Environment
Foi atualizado:
23 abr 2017 ano
Indicadores de alterações dos valores ao longo dos anos
Mínimo:
8.549
1 jan 1971 ano
Máximo:
12.161
1 jan 1991 ano
Na data de observação
Valor
Mudança absoluta
A alteração em relação ao valor anterior
1 jan 1971 ano
8.549
+8.549
0.0%
1 jan 1972 ano
9.089
+0.54
6.32%
1 jan 1973 ano
9.373
+0.283
3.12%
1 jan 1974 ano
9.112
-0.261
-2.78%
1 jan 1975 ano
8.763
-0.349
-3.83%
1 jan 1976 ano
9.066
+0.303
3.46%
1 jan 1977 ano
9.599
+0.533
5.88%
1 jan 1978 ano
9.226
-0.373
-3.89%
1 jan 1979 ano
9.689
+0.463
5.02%
1 jan 1980 ano
9.352
-0.336
-3.47%
1 jan 1981 ano
9.164
-0.188
-2.01%
1 jan 1982 ano
9.477
+0.313
3.42%
1 jan 1983 ano
10.925
+1.448
15.27%
1 jan 1984 ano
12.129
+1.204
11.02%
1 jan 1985 ano
11.592
-0.537
-4.43%
1 jan 1986 ano
11.567
-0.025
-0.22%
1 jan 1987 ano
11.402
-0.164
-1.42%
1 jan 1988 ano
11.26
-0.143
-1.25%
1 jan 1989 ano
11.728
+0.468
4.16%
1 jan 1990 ano
10.683
-1.045
-8.91%
1 jan 1991 ano
12.161
+1.478
13.83%
1 jan 1992 ano
11.709
-0.452
-3.72%
1 jan 1993 ano
10.824
-0.884
-7.55%
1 jan 1994 ano
10.52
-0.305
-2.81%
1 jan 1995 ano
10.497
-0.022
-0.21%
1 jan 1996 ano
11.269
+0.771
7.35%
1 jan 1997 ano
11.178
-0.091
-0.8%
1 jan 1998 ano
10.904
-0.274
-2.45%
1 jan 1999 ano
11.287
+0.383
3.51%
1 jan 2000 ano
11.545
+0.258
2.29%
1 jan 2001 ano
11.157
-0.389
-3.37%
1 jan 2002 ano
11.305
+0.148
1.33%
1 jan 2003 ano
11.223
-0.081
-0.72%
1 jan 2004 ano
11.31
+0.087
0.77%
1 jan 2005 ano
10.801
-0.509
-4.5%
1 jan 2006 ano
10.504
-0.297
-2.75%
1 jan 2007 ano
10.26
-0.244
-2.32%
1 jan 2008 ano
10.181
-0.079
-0.77%
1 jan 2009 ano
10.009
-0.172
-1.69%
1 jan 2010 ano
10.866
+0.857
8.57%
1 jan 2011 ano
10.322
-0.544
-5.01%
1 jan 2012 ano
10.454
+0.132
1.28%
1 jan 2013 ano
10.609
+0.155
1.48%
1 jan 2014 ano
11.11
+0.501
4.72%
1 jan 2015 ano
11.061
-0.049
-0.44%
Classificação de países por estatísticas atuais por anos


Comentários: