29
/pt/
pt
AIzaSyAYiBZKx7MnpbEhh9jyipgxe19OcubqV5w
April 1, 2024
268903
Turkey
TUR
true
2
1
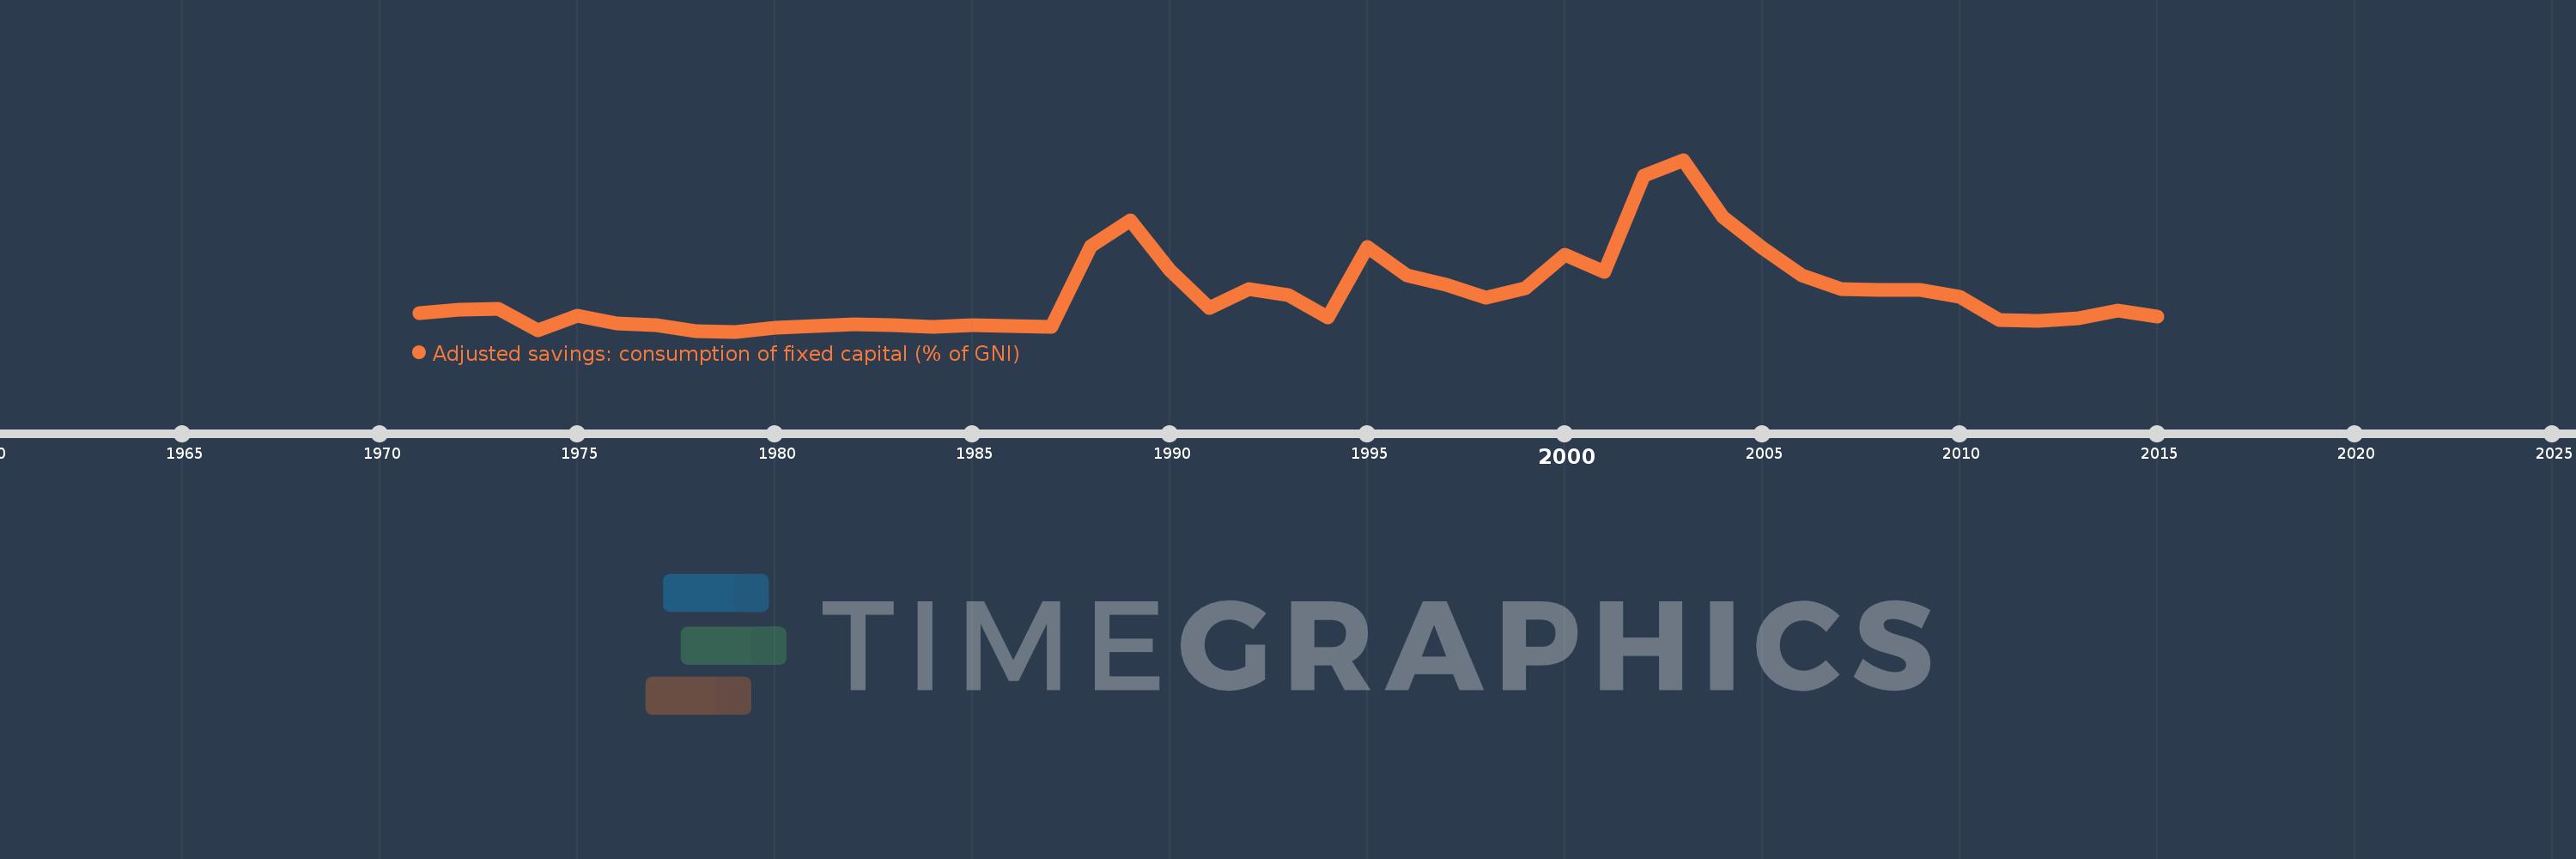
Adjusted savings: consumption of fixed capital (% of GNI)
2015,2014,2013,2012,2011,2010,2009,2008,2007,2006,2005,2004,2003,2002,2001,2000,1999,1998,1997,1996,1995,1994,1993,1992,1991,1990,1989,1988,1987,1986,1985,1984,1983,1982,1981,1980,1979,1978,1977,1976,1975,1974,1973,1972,1971
Estas estatísticas em outros países:
AfghanistanAlbaniaAlgeriaAndorraAngolaAntigua and BarbudaArab WorldArgentinaArmeniaAustraliaAustriaAzerbaijanBahamas, TheBahrainBangladeshBarbadosBelarusBelgiumBelizeBeninBermudaBhutanBoliviaBosnia and HerzegovinaBotswanaBrazilBrunei DarussalamBulgariaBurkina FasoBurundiCabo VerdeCambodiaCameroonCanadaCaribbean small statesCentral African RepublicCentral Europe and the BalticsChadChileChinaColombiaComorosCongo, Dem. Rep.Congo, Rep.Costa RicaCote d'IvoireCroatiaCubaCyprusCzech RepublicDenmarkDjiboutiDominicaDominican RepublicEarly-demographic dividendEast Asia & PacificEast Asia & Pacific (excluding high income)East Asia & Pacific (IDA & IBRD countries)EcuadorEgypt, Arab Rep.El SalvadorEquatorial GuineaEritreaEstoniaEthiopiaEuro areaEurope & Central AsiaEurope & Central Asia (excluding high income)Europe & Central Asia (IDA & IBRD countries)European UnionFijiFinlandFragile and conflict affected situationsFranceGabonGambia, TheGeorgiaGermanyGhanaGreeceGreenlandGrenadaGuatemalaGuineaGuinea-BissauGuyanaHaitiHeavily indebted poor countries (HIPC)High incomeHondurasHong Kong SAR, ChinaHungaryIBRD onlyIcelandIDA & IBRD totalIDA blendIDA onlyIDA totalIndiaIndonesiaIran, Islamic Rep.IraqIrelandIsraelItalyJamaicaJapanJordanKazakhstanKenyaKiribatiKorea, Rep.KosovoKuwaitKyrgyz RepublicLao PDRLate-demographic dividendLatin America & Caribbean Latin America & Caribbean (excluding high income)Latin America & the Caribbean (IDA & IBRD countries)LatviaLeast developed countries: UN classificationLebanonLesothoLiberiaLibyaLiechtensteinLithuaniaLow & middle incomeLow incomeLower middle incomeLuxembourgMacao SAR, ChinaMacedonia, FYRMadagascarMalawiMalaysiaMaldivesMaliMaltaMarshall IslandsMauritaniaMauritiusMexicoMicronesia, Fed. Sts.Middle East & North AfricaMiddle East & North Africa (excluding high income)Middle East & North Africa (IDA & IBRD countries)Middle incomeMoldovaMonacoMongoliaMontenegroMoroccoMozambiqueMyanmarNamibiaNepalNetherlandsNew ZealandNicaraguaNigerNigeriaNorth AmericaNorwayOECD membersOmanOther small statesPacific island small statesPakistanPalauPanamaPapua New GuineaParaguayPeruPhilippinesPolandPortugalPost-demographic dividendPre-demographic dividendPuerto RicoQatarRomaniaRussian FederationRwandaSamoaSan MarinoSao Tome and PrincipeSaudi ArabiaSenegalSerbiaSeychellesSierra LeoneSingaporeSlovak RepublicSloveniaSmall statesSolomon IslandsSouth AfricaSouth AsiaSouth Asia (IDA & IBRD)SpainSri LankaSt. Kitts and NevisSt. LuciaSt. Vincent and the GrenadinesSub-Saharan Africa Sub-Saharan Africa (excluding high income)Sub-Saharan Africa (IDA & IBRD countries)SudanSurinameSwazilandSwedenSwitzerlandSyrian Arab RepublicTajikistanTanzaniaThailandTimor-LesteTogoTongaTrinidad and TobagoTunisiaTurkeyTurkmenistanTuvaluUgandaUkraineUnited Arab EmiratesUnited KingdomUnited StatesUpper middle incomeUruguayUzbekistanVanuatuVenezuela, RBVietnamWest Bank and GazaWorldYemen, Rep.ZambiaZimbabwe Linha do tempo:
Nesta escala de tempo está apresentado um gráfico de 1971 ano até 2015 ano Turkey. Dados de 1970 ano ausente. O número de observações reais por data: 45.
Fonte (nome):
Indicadores de desenvolvimento mundial
Fonte (organização):
World Bank staff estimates using data from the United Nations Statistics Division's National Accounts Statistics.
Categorias:
Economy & Growth, Environment
Foi atualizado:
23 abr 2017 ano
Indicadores de alterações dos valores ao longo dos anos
Mínimo:
5.495
1 jan 1979 ano
Máximo:
8.824
1 jan 2003 ano
Na data de observação
Valor
Mudança absoluta
A alteração em relação ao valor anterior
1 jan 1971 ano
5.852
+5.852
0.0%
1 jan 1972 ano
5.914
+0.062
1.06%
1 jan 1973 ano
5.937
+0.022
0.38%
1 jan 1974 ano
5.512
-0.425
-7.15%
1 jan 1975 ano
5.799
+0.287
5.2%
1 jan 1976 ano
5.654
-0.145
-2.5%
1 jan 1977 ano
5.625
-0.029
-0.51%
1 jan 1978 ano
5.505
-0.12
-2.14%
1 jan 1979 ano
5.495
-0.01
-0.18%
1 jan 1980 ano
5.57
+0.075
1.37%
1 jan 1981 ano
5.598
+0.028
0.51%
1 jan 1982 ano
5.633
+0.034
0.62%
1 jan 1983 ano
5.626
-0.006
-0.11%
1 jan 1984 ano
5.58
-0.046
-0.82%
1 jan 1985 ano
5.623
+0.043
0.77%
1 jan 1986 ano
5.609
-0.014
-0.26%
1 jan 1987 ano
5.589
-0.02
-0.36%
1 jan 1988 ano
7.155
+1.566
28.02%
1 jan 1989 ano
7.654
+0.499
6.97%
1 jan 1990 ano
6.69
-0.964
-12.59%
1 jan 1991 ano
5.956
-0.734
-10.97%
1 jan 1992 ano
6.311
+0.355
5.96%
1 jan 1993 ano
6.21
-0.101
-1.6%
1 jan 1994 ano
5.776
-0.434
-6.99%
1 jan 1995 ano
7.139
+1.363
23.59%
1 jan 1996 ano
6.584
-0.554
-7.76%
1 jan 1997 ano
6.402
-0.183
-2.77%
1 jan 1998 ano
6.159
-0.243
-3.8%
1 jan 1999 ano
6.34
+0.182
2.95%
1 jan 2000 ano
6.98
+0.639
10.08%
1 jan 2001 ano
6.648
-0.331
-4.74%
1 jan 2002 ano
8.519
+1.87
28.13%
1 jan 2003 ano
8.824
+0.306
3.59%
1 jan 2004 ano
7.724
-1.101
-12.47%
1 jan 2005 ano
7.11
-0.614
-7.95%
1 jan 2006 ano
6.588
-0.521
-7.33%
1 jan 2007 ano
6.323
-0.265
-4.02%
1 jan 2008 ano
6.305
-0.019
-0.29%
1 jan 2009 ano
6.303
-0.001
-0.02%
1 jan 2010 ano
6.176
-0.128
-2.03%
1 jan 2011 ano
5.723
-0.453
-7.34%
1 jan 2012 ano
5.695
-0.028
-0.49%
1 jan 2013 ano
5.754
+0.059
1.03%
1 jan 2014 ano
5.895
+0.142
2.46%
1 jan 2015 ano
5.788
-0.107
-1.82%
Classificação de países por estatísticas atuais por anos


Comentários: