29
/pt/
pt
AIzaSyAYiBZKx7MnpbEhh9jyipgxe19OcubqV5w
April 1, 2024
34725
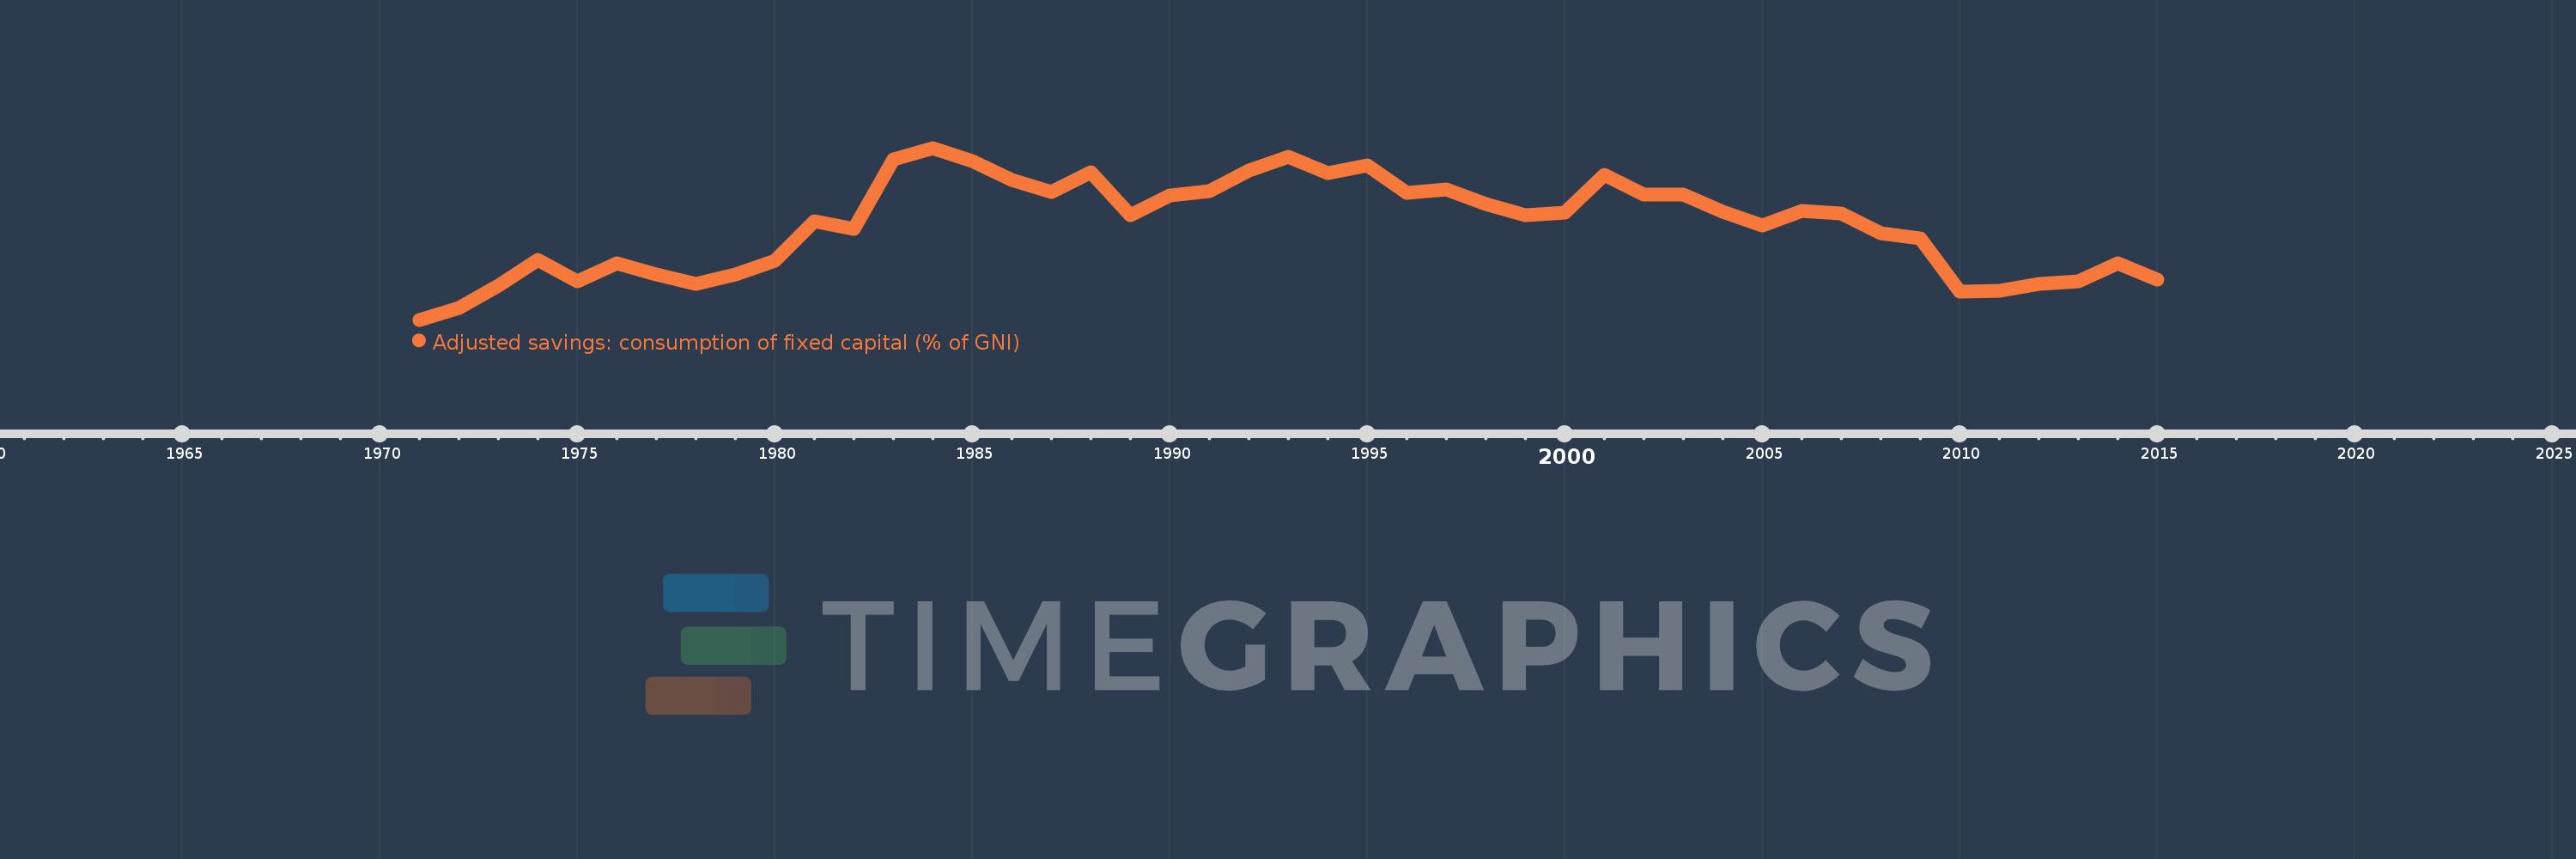
Heavily indebted poor countries (HIPC)
HPC
false
2
1
Adjusted savings: consumption of fixed capital (% of GNI)
2015,2014,2013,2012,2011,2010,2009,2008,2007,2006,2005,2004,2003,2002,2001,2000,1999,1998,1997,1996,1995,1994,1993,1992,1991,1990,1989,1988,1987,1986,1985,1984,1983,1982,1981,1980,1979,1978,1977,1976,1975,1974,1973,1972,1971
Estas estatísticas em outros países:
AfghanistanAlbaniaAlgeriaAndorraAngolaAntigua and BarbudaArab WorldArgentinaArmeniaAustraliaAustriaAzerbaijanBahamas, TheBahrainBangladeshBarbadosBelarusBelgiumBelizeBeninBermudaBhutanBoliviaBosnia and HerzegovinaBotswanaBrazilBrunei DarussalamBulgariaBurkina FasoBurundiCabo VerdeCambodiaCameroonCanadaCaribbean small statesCentral African RepublicCentral Europe and the BalticsChadChileChinaColombiaComorosCongo, Dem. Rep.Congo, Rep.Costa RicaCote d'IvoireCroatiaCubaCyprusCzech RepublicDenmarkDjiboutiDominicaDominican RepublicEarly-demographic dividendEast Asia & PacificEast Asia & Pacific (excluding high income)East Asia & Pacific (IDA & IBRD countries)EcuadorEgypt, Arab Rep.El SalvadorEquatorial GuineaEritreaEstoniaEthiopiaEuro areaEurope & Central AsiaEurope & Central Asia (excluding high income)Europe & Central Asia (IDA & IBRD countries)European UnionFijiFinlandFragile and conflict affected situationsFranceGabonGambia, TheGeorgiaGermanyGhanaGreeceGreenlandGrenadaGuatemalaGuineaGuinea-BissauGuyanaHaitiHeavily indebted poor countries (HIPC)High incomeHondurasHong Kong SAR, ChinaHungaryIBRD onlyIcelandIDA & IBRD totalIDA blendIDA onlyIDA totalIndiaIndonesiaIran, Islamic Rep.IraqIrelandIsraelItalyJamaicaJapanJordanKazakhstanKenyaKiribatiKorea, Rep.KosovoKuwaitKyrgyz RepublicLao PDRLate-demographic dividendLatin America & Caribbean Latin America & Caribbean (excluding high income)Latin America & the Caribbean (IDA & IBRD countries)LatviaLeast developed countries: UN classificationLebanonLesothoLiberiaLibyaLiechtensteinLithuaniaLow & middle incomeLow incomeLower middle incomeLuxembourgMacao SAR, ChinaMacedonia, FYRMadagascarMalawiMalaysiaMaldivesMaliMaltaMarshall IslandsMauritaniaMauritiusMexicoMicronesia, Fed. Sts.Middle East & North AfricaMiddle East & North Africa (excluding high income)Middle East & North Africa (IDA & IBRD countries)Middle incomeMoldovaMonacoMongoliaMontenegroMoroccoMozambiqueMyanmarNamibiaNepalNetherlandsNew ZealandNicaraguaNigerNigeriaNorth AmericaNorwayOECD membersOmanOther small statesPacific island small statesPakistanPalauPanamaPapua New GuineaParaguayPeruPhilippinesPolandPortugalPost-demographic dividendPre-demographic dividendPuerto RicoQatarRomaniaRussian FederationRwandaSamoaSan MarinoSao Tome and PrincipeSaudi ArabiaSenegalSerbiaSeychellesSierra LeoneSingaporeSlovak RepublicSloveniaSmall statesSolomon IslandsSouth AfricaSouth AsiaSouth Asia (IDA & IBRD)SpainSri LankaSt. Kitts and NevisSt. LuciaSt. Vincent and the GrenadinesSub-Saharan Africa Sub-Saharan Africa (excluding high income)Sub-Saharan Africa (IDA & IBRD countries)SudanSurinameSwazilandSwedenSwitzerlandSyrian Arab RepublicTajikistanTanzaniaThailandTimor-LesteTogoTongaTrinidad and TobagoTunisiaTurkeyTurkmenistanTuvaluUgandaUkraineUnited Arab EmiratesUnited KingdomUnited StatesUpper middle incomeUruguayUzbekistanVanuatuVenezuela, RBVietnamWest Bank and GazaWorldYemen, Rep.ZambiaZimbabwe Linha do tempo:
Nesta escala de tempo está apresentado um gráfico de 1971 ano até 2015 ano Heavily indebted poor countries (HIPC). Dados de 1970 ano ausente. O número de observações reais por data: 45.
Fonte (nome):
Indicadores de desenvolvimento mundial
Fonte (organização):
World Bank staff estimates using data from the United Nations Statistics Division's National Accounts Statistics.
Categorias:
Economy & Growth, Environment
Foi atualizado:
23 abr 2017 ano
Indicadores de alterações dos valores ao longo dos anos
Mínimo:
6.377
1 jan 1971 ano
Máximo:
8.664
1 jan 1984 ano
Na data de observação
Valor
Mudança absoluta
A alteração em relação ao valor anterior
1 jan 1971 ano
6.377
+6.377
0.0%
1 jan 1972 ano
6.532
+0.155
2.44%
1 jan 1973 ano
6.832
+0.3
4.59%
1 jan 1974 ano
7.177
+0.345
5.05%
1 jan 1975 ano
6.893
-0.285
-3.97%
1 jan 1976 ano
7.133
+0.24
3.49%
1 jan 1977 ano
6.979
-0.154
-2.16%
1 jan 1978 ano
6.859
-0.12
-1.72%
1 jan 1979 ano
6.984
+0.125
1.82%
1 jan 1980 ano
7.159
+0.175
2.51%
1 jan 1981 ano
7.683
+0.524
7.32%
1 jan 1982 ano
7.586
-0.097
-1.26%
1 jan 1983 ano
8.512
+0.927
12.21%
1 jan 1984 ano
8.664
+0.152
1.78%
1 jan 1985 ano
8.488
-0.177
-2.04%
1 jan 1986 ano
8.232
-0.255
-3.01%
1 jan 1987 ano
8.077
-0.155
-1.88%
1 jan 1988 ano
8.346
+0.268
3.32%
1 jan 1989 ano
7.769
-0.577
-6.92%
1 jan 1990 ano
8.029
+0.26
3.34%
1 jan 1991 ano
8.094
+0.065
0.82%
1 jan 1992 ano
8.358
+0.264
3.26%
1 jan 1993 ano
8.544
+0.186
2.22%
1 jan 1994 ano
8.324
-0.22
-2.57%
1 jan 1995 ano
8.432
+0.109
1.31%
1 jan 1996 ano
8.071
-0.361
-4.28%
1 jan 1997 ano
8.115
+0.043
0.54%
1 jan 1998 ano
7.913
-0.202
-2.49%
1 jan 1999 ano
7.772
-0.141
-1.78%
1 jan 2000 ano
7.805
+0.033
0.43%
1 jan 2001 ano
8.31
+0.505
6.48%
1 jan 2002 ano
8.042
-0.268
-3.23%
1 jan 2003 ano
8.043
+0.001
0.01%
1 jan 2004 ano
7.81
-0.232
-2.89%
1 jan 2005 ano
7.632
-0.178
-2.28%
1 jan 2006 ano
7.823
+0.191
2.5%
1 jan 2007 ano
7.787
-0.037
-0.47%
1 jan 2008 ano
7.527
-0.26
-3.34%
1 jan 2009 ano
7.456
-0.071
-0.94%
1 jan 2010 ano
6.751
-0.705
-9.45%
1 jan 2011 ano
6.762
+0.011
0.16%
1 jan 2012 ano
6.849
+0.087
1.29%
1 jan 2013 ano
6.889
+0.04
0.58%
1 jan 2014 ano
7.123
+0.234
3.4%
1 jan 2015 ano
6.915
-0.208
-2.92%
Classificação de países por estatísticas atuais por anos


Comentários: