29
/pt/
pt
AIzaSyAYiBZKx7MnpbEhh9jyipgxe19OcubqV5w
April 1, 2024
225570
Portugal
PRT
true
2
1
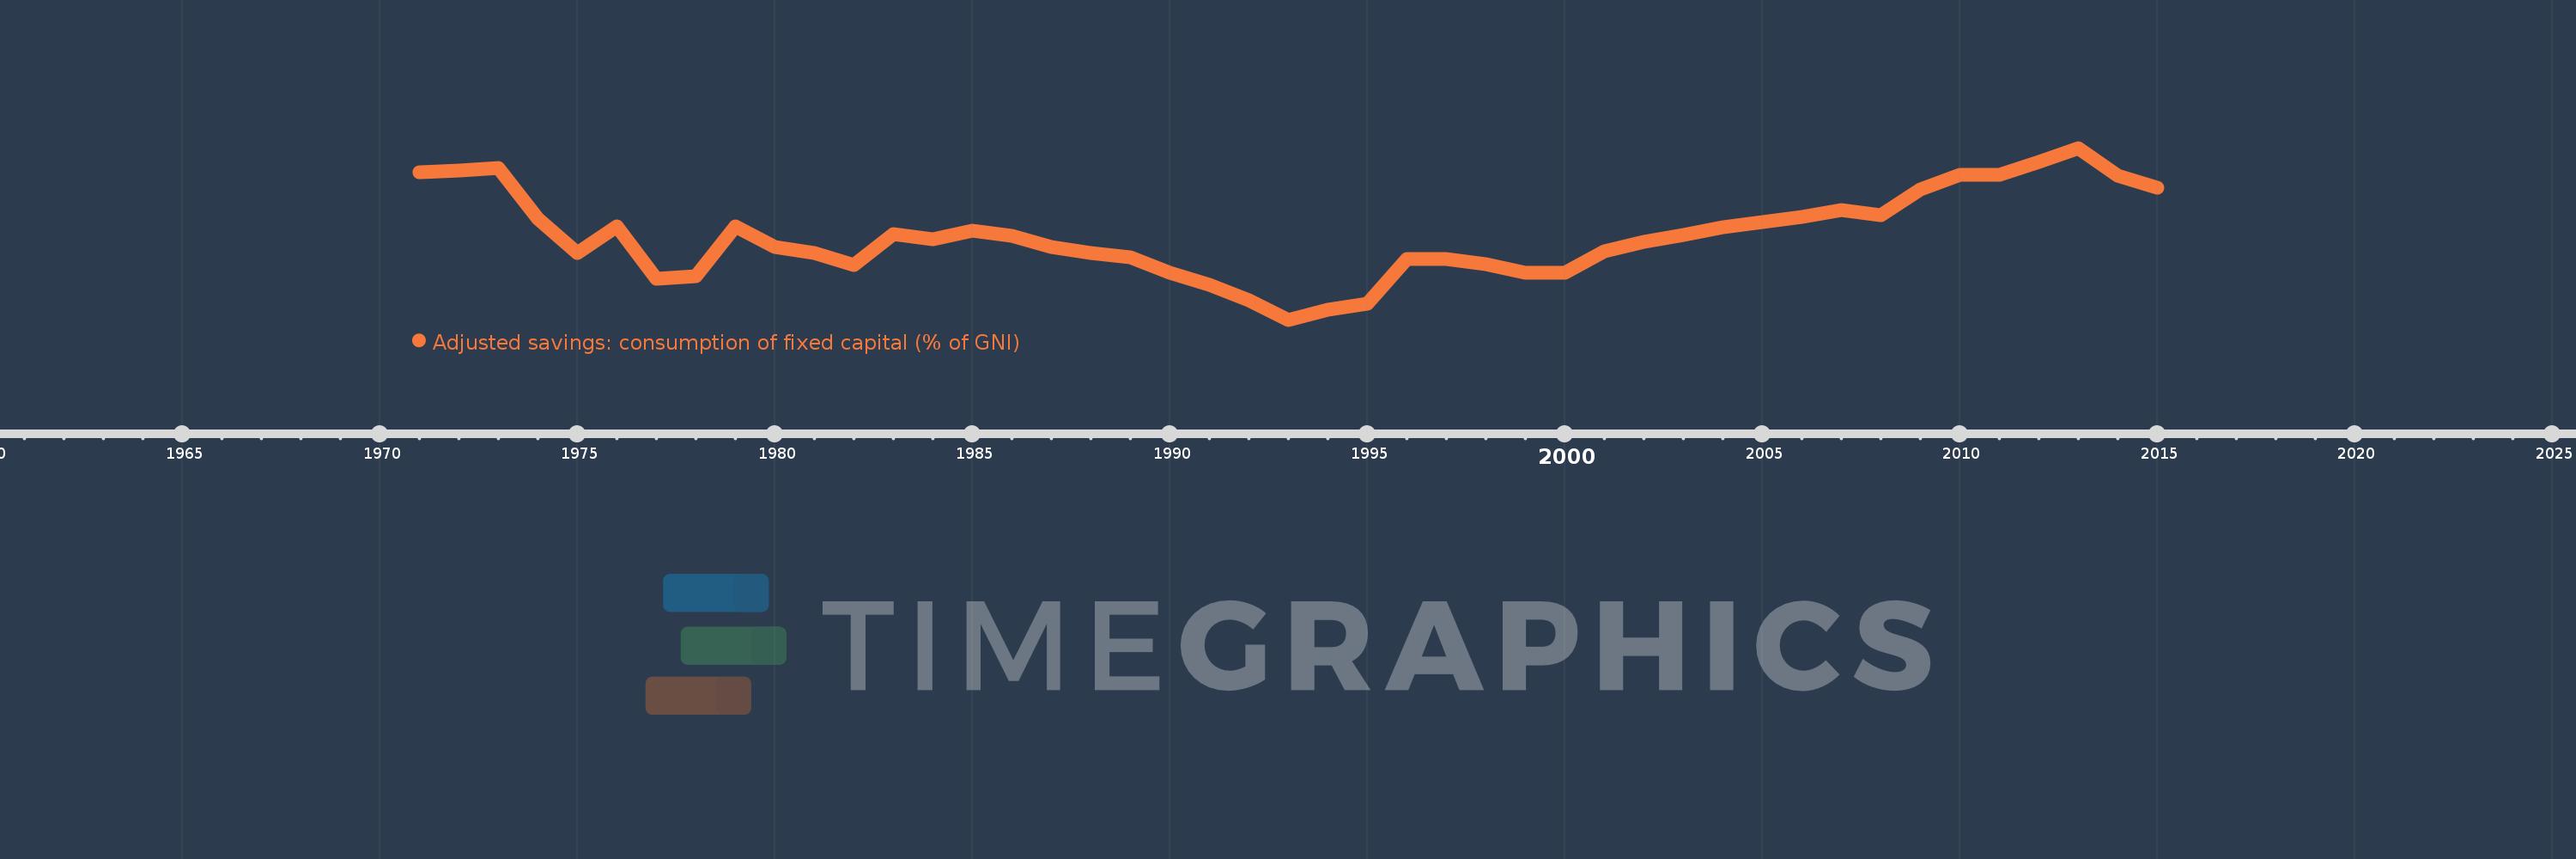
Adjusted savings: consumption of fixed capital (% of GNI)
2015,2014,2013,2012,2011,2010,2009,2008,2007,2006,2005,2004,2003,2002,2001,2000,1999,1998,1997,1996,1995,1994,1993,1992,1991,1990,1989,1988,1987,1986,1985,1984,1983,1982,1981,1980,1979,1978,1977,1976,1975,1974,1973,1972,1971
Estas estatísticas em outros países:
AfghanistanAlbaniaAlgeriaAndorraAngolaAntigua and BarbudaArab WorldArgentinaArmeniaAustraliaAustriaAzerbaijanBahamas, TheBahrainBangladeshBarbadosBelarusBelgiumBelizeBeninBermudaBhutanBoliviaBosnia and HerzegovinaBotswanaBrazilBrunei DarussalamBulgariaBurkina FasoBurundiCabo VerdeCambodiaCameroonCanadaCaribbean small statesCentral African RepublicCentral Europe and the BalticsChadChileChinaColombiaComorosCongo, Dem. Rep.Congo, Rep.Costa RicaCote d'IvoireCroatiaCubaCyprusCzech RepublicDenmarkDjiboutiDominicaDominican RepublicEarly-demographic dividendEast Asia & PacificEast Asia & Pacific (excluding high income)East Asia & Pacific (IDA & IBRD countries)EcuadorEgypt, Arab Rep.El SalvadorEquatorial GuineaEritreaEstoniaEthiopiaEuro areaEurope & Central AsiaEurope & Central Asia (excluding high income)Europe & Central Asia (IDA & IBRD countries)European UnionFijiFinlandFragile and conflict affected situationsFranceGabonGambia, TheGeorgiaGermanyGhanaGreeceGreenlandGrenadaGuatemalaGuineaGuinea-BissauGuyanaHaitiHeavily indebted poor countries (HIPC)High incomeHondurasHong Kong SAR, ChinaHungaryIBRD onlyIcelandIDA & IBRD totalIDA blendIDA onlyIDA totalIndiaIndonesiaIran, Islamic Rep.IraqIrelandIsraelItalyJamaicaJapanJordanKazakhstanKenyaKiribatiKorea, Rep.KosovoKuwaitKyrgyz RepublicLao PDRLate-demographic dividendLatin America & Caribbean Latin America & Caribbean (excluding high income)Latin America & the Caribbean (IDA & IBRD countries)LatviaLeast developed countries: UN classificationLebanonLesothoLiberiaLibyaLiechtensteinLithuaniaLow & middle incomeLow incomeLower middle incomeLuxembourgMacao SAR, ChinaMacedonia, FYRMadagascarMalawiMalaysiaMaldivesMaliMaltaMarshall IslandsMauritaniaMauritiusMexicoMicronesia, Fed. Sts.Middle East & North AfricaMiddle East & North Africa (excluding high income)Middle East & North Africa (IDA & IBRD countries)Middle incomeMoldovaMonacoMongoliaMontenegroMoroccoMozambiqueMyanmarNamibiaNepalNetherlandsNew ZealandNicaraguaNigerNigeriaNorth AmericaNorwayOECD membersOmanOther small statesPacific island small statesPakistanPalauPanamaPapua New GuineaParaguayPeruPhilippinesPolandPortugalPost-demographic dividendPre-demographic dividendPuerto RicoQatarRomaniaRussian FederationRwandaSamoaSan MarinoSao Tome and PrincipeSaudi ArabiaSenegalSerbiaSeychellesSierra LeoneSingaporeSlovak RepublicSloveniaSmall statesSolomon IslandsSouth AfricaSouth AsiaSouth Asia (IDA & IBRD)SpainSri LankaSt. Kitts and NevisSt. LuciaSt. Vincent and the GrenadinesSub-Saharan Africa Sub-Saharan Africa (excluding high income)Sub-Saharan Africa (IDA & IBRD countries)SudanSurinameSwazilandSwedenSwitzerlandSyrian Arab RepublicTajikistanTanzaniaThailandTimor-LesteTogoTongaTrinidad and TobagoTunisiaTurkeyTurkmenistanTuvaluUgandaUkraineUnited Arab EmiratesUnited KingdomUnited StatesUpper middle incomeUruguayUzbekistanVanuatuVenezuela, RBVietnamWest Bank and GazaWorldYemen, Rep.ZambiaZimbabwe Linha do tempo:
Nesta escala de tempo está apresentado um gráfico de 1971 ano até 2015 ano Portugal. Dados de 1970 ano ausente. O número de observações reais por data: 45.
Fonte (nome):
Indicadores de desenvolvimento mundial
Fonte (organização):
World Bank staff estimates using data from the United Nations Statistics Division's National Accounts Statistics.
Categorias:
Economy & Growth, Environment
Foi atualizado:
23 abr 2017 ano
Indicadores de alterações dos valores ao longo dos anos
Mínimo:
13.597
1 jan 1993 ano
Máximo:
18.593
1 jan 2013 ano
Na data de observação
Valor
Mudança absoluta
A alteração em relação ao valor anterior
1 jan 1971 ano
17.888
+17.888
0.0%
1 jan 1972 ano
17.938
+0.05
0.28%
1 jan 1973 ano
18.016
+0.078
0.43%
1 jan 1974 ano
16.544
-1.472
-8.17%
1 jan 1975 ano
15.528
-1.016
-6.14%
1 jan 1976 ano
16.308
+0.781
5.03%
1 jan 1977 ano
14.796
-1.513
-9.28%
1 jan 1978 ano
14.875
+0.08
0.54%
1 jan 1979 ano
16.32
+1.444
9.71%
1 jan 1980 ano
15.701
-0.619
-3.79%
1 jan 1981 ano
15.539
-0.162
-1.03%
1 jan 1982 ano
15.19
-0.348
-2.24%
1 jan 1983 ano
16.077
+0.886
5.84%
1 jan 1984 ano
15.932
-0.145
-0.9%
1 jan 1985 ano
16.175
+0.243
1.53%
1 jan 1986 ano
16.042
-0.133
-0.83%
1 jan 1987 ano
15.712
-0.33
-2.05%
1 jan 1988 ano
15.544
-0.168
-1.07%
1 jan 1989 ano
15.425
-0.12
-0.77%
1 jan 1990 ano
14.953
-0.471
-3.06%
1 jan 1991 ano
14.606
-0.347
-2.32%
1 jan 1992 ano
14.154
-0.452
-3.1%
1 jan 1993 ano
13.597
-0.557
-3.94%
1 jan 1994 ano
13.894
+0.298
2.19%
1 jan 1995 ano
14.067
+0.173
1.25%
1 jan 1996 ano
15.374
+1.307
9.29%
1 jan 1997 ano
15.361
-0.013
-0.08%
1 jan 1998 ano
15.212
-0.149
-0.97%
1 jan 1999 ano
14.954
-0.258
-1.7%
1 jan 2000 ano
14.962
+0.008
0.06%
1 jan 2001 ano
15.591
+0.629
4.2%
1 jan 2002 ano
15.864
+0.273
1.75%
1 jan 2003 ano
16.068
+0.204
1.28%
1 jan 2004 ano
16.282
+0.214
1.33%
1 jan 2005 ano
16.432
+0.15
0.92%
1 jan 2006 ano
16.578
+0.146
0.89%
1 jan 2007 ano
16.799
+0.222
1.34%
1 jan 2008 ano
16.626
-0.173
-1.03%
1 jan 2009 ano
17.397
+0.77
4.63%
1 jan 2010 ano
17.807
+0.41
2.36%
1 jan 2011 ano
17.809
+0.002
0.01%
1 jan 2012 ano
18.191
+0.382
2.15%
1 jan 2013 ano
18.593
+0.402
2.21%
1 jan 2014 ano
17.791
-0.802
-4.31%
1 jan 2015 ano
17.429
-0.362
-2.03%
Classificação de países por estatísticas atuais por anos


Comentários: