29
/it/
it
AIzaSyAYiBZKx7MnpbEhh9jyipgxe19OcubqV5w
April 1, 2024
90718
Brazil
BRA
true
2
1
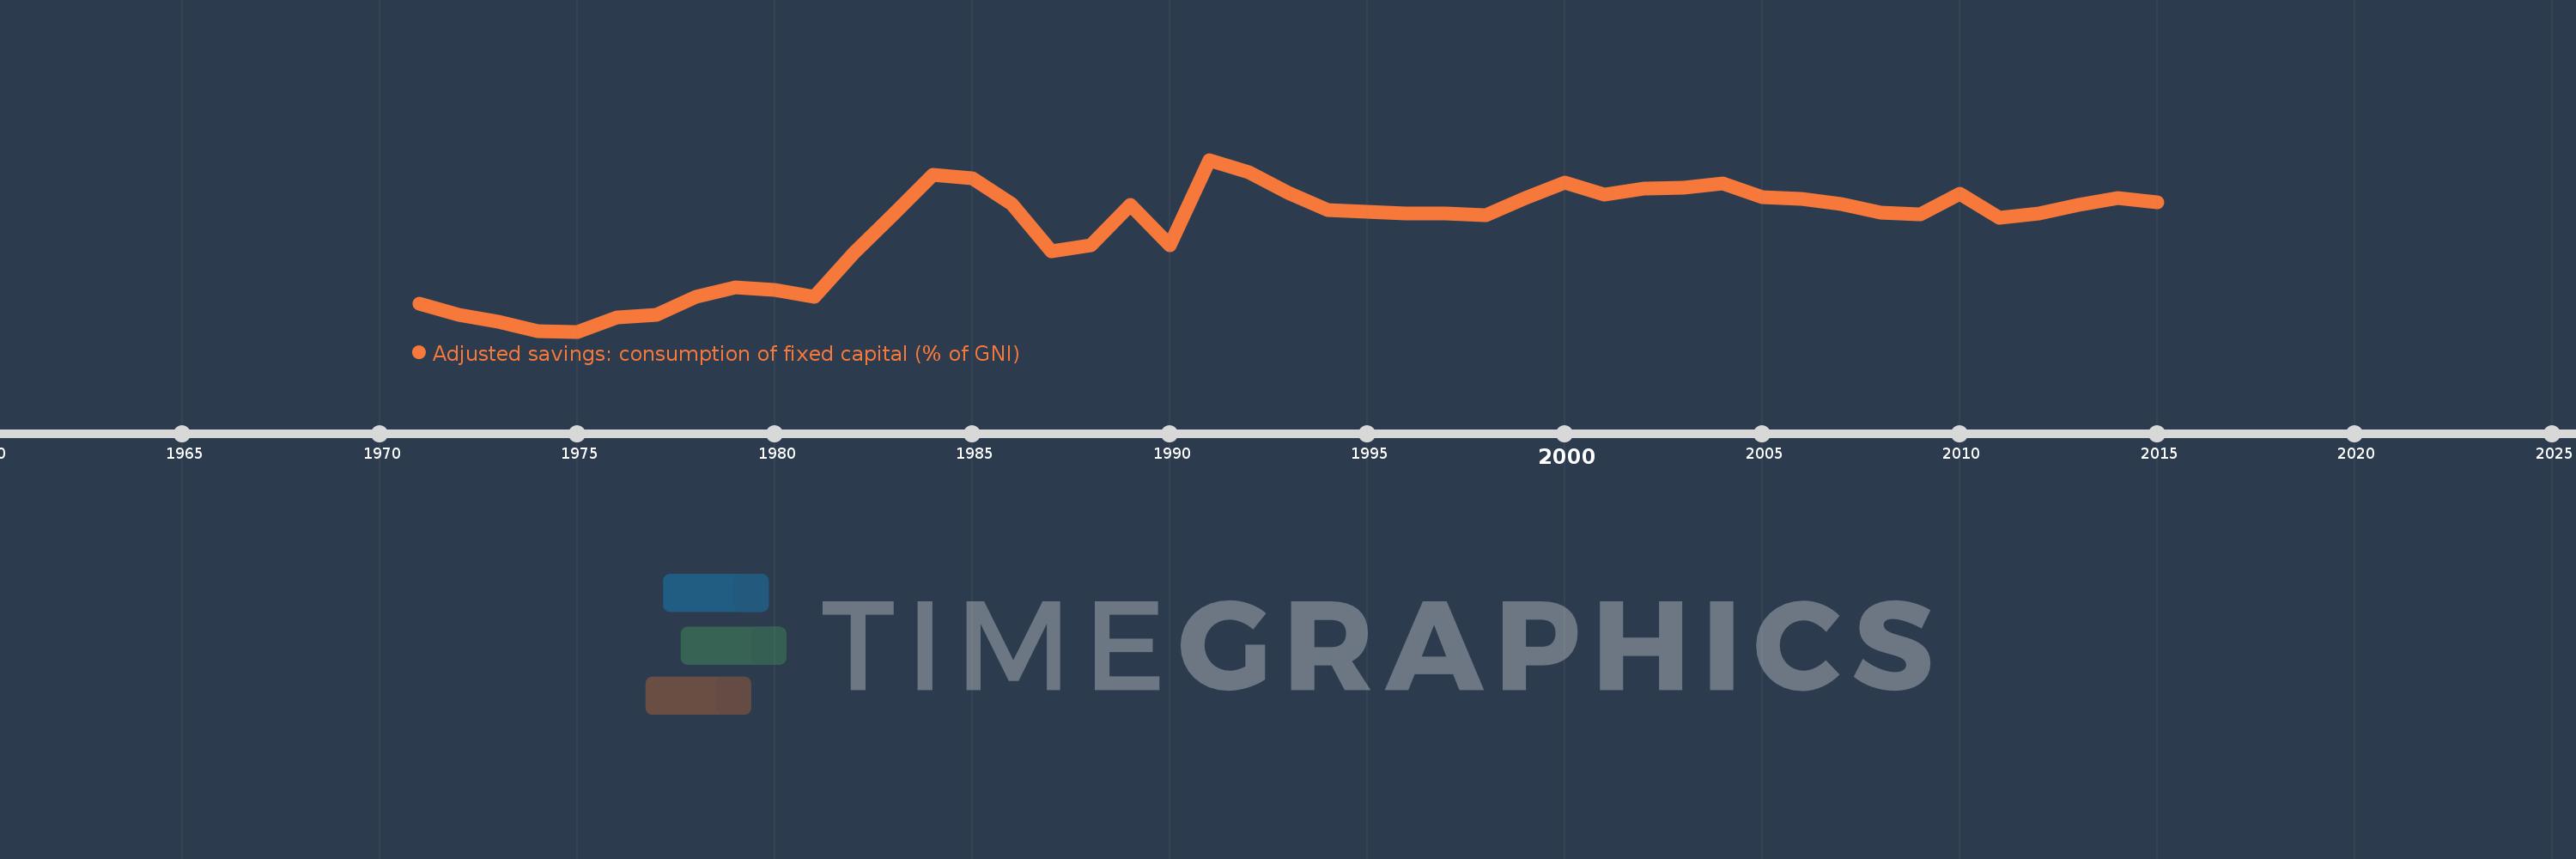
Adjusted savings: consumption of fixed capital (% of GNI)
2015,2014,2013,2012,2011,2010,2009,2008,2007,2006,2005,2004,2003,2002,2001,2000,1999,1998,1997,1996,1995,1994,1993,1992,1991,1990,1989,1988,1987,1986,1985,1984,1983,1982,1981,1980,1979,1978,1977,1976,1975,1974,1973,1972,1971
Queste statistiche in altri paesi:
AfghanistanAlbaniaAlgeriaAndorraAngolaAntigua and BarbudaArab WorldArgentinaArmeniaAustraliaAustriaAzerbaijanBahamas, TheBahrainBangladeshBarbadosBelarusBelgiumBelizeBeninBermudaBhutanBoliviaBosnia and HerzegovinaBotswanaBrazilBrunei DarussalamBulgariaBurkina FasoBurundiCabo VerdeCambodiaCameroonCanadaCaribbean small statesCentral African RepublicCentral Europe and the BalticsChadChileChinaColombiaComorosCongo, Dem. Rep.Congo, Rep.Costa RicaCote d'IvoireCroatiaCubaCyprusCzech RepublicDenmarkDjiboutiDominicaDominican RepublicEarly-demographic dividendEast Asia & PacificEast Asia & Pacific (excluding high income)East Asia & Pacific (IDA & IBRD countries)EcuadorEgypt, Arab Rep.El SalvadorEquatorial GuineaEritreaEstoniaEthiopiaEuro areaEurope & Central AsiaEurope & Central Asia (excluding high income)Europe & Central Asia (IDA & IBRD countries)European UnionFijiFinlandFragile and conflict affected situationsFranceGabonGambia, TheGeorgiaGermanyGhanaGreeceGreenlandGrenadaGuatemalaGuineaGuinea-BissauGuyanaHaitiHeavily indebted poor countries (HIPC)High incomeHondurasHong Kong SAR, ChinaHungaryIBRD onlyIcelandIDA & IBRD totalIDA blendIDA onlyIDA totalIndiaIndonesiaIran, Islamic Rep.IraqIrelandIsraelItalyJamaicaJapanJordanKazakhstanKenyaKiribatiKorea, Rep.KosovoKuwaitKyrgyz RepublicLao PDRLate-demographic dividendLatin America & Caribbean Latin America & Caribbean (excluding high income)Latin America & the Caribbean (IDA & IBRD countries)LatviaLeast developed countries: UN classificationLebanonLesothoLiberiaLibyaLiechtensteinLithuaniaLow & middle incomeLow incomeLower middle incomeLuxembourgMacao SAR, ChinaMacedonia, FYRMadagascarMalawiMalaysiaMaldivesMaliMaltaMarshall IslandsMauritaniaMauritiusMexicoMicronesia, Fed. Sts.Middle East & North AfricaMiddle East & North Africa (excluding high income)Middle East & North Africa (IDA & IBRD countries)Middle incomeMoldovaMonacoMongoliaMontenegroMoroccoMozambiqueMyanmarNamibiaNepalNetherlandsNew ZealandNicaraguaNigerNigeriaNorth AmericaNorwayOECD membersOmanOther small statesPacific island small statesPakistanPalauPanamaPapua New GuineaParaguayPeruPhilippinesPolandPortugalPost-demographic dividendPre-demographic dividendPuerto RicoQatarRomaniaRussian FederationRwandaSamoaSan MarinoSao Tome and PrincipeSaudi ArabiaSenegalSerbiaSeychellesSierra LeoneSingaporeSlovak RepublicSloveniaSmall statesSolomon IslandsSouth AfricaSouth AsiaSouth Asia (IDA & IBRD)SpainSri LankaSt. Kitts and NevisSt. LuciaSt. Vincent and the GrenadinesSub-Saharan Africa Sub-Saharan Africa (excluding high income)Sub-Saharan Africa (IDA & IBRD countries)SudanSurinameSwazilandSwedenSwitzerlandSyrian Arab RepublicTajikistanTanzaniaThailandTimor-LesteTogoTongaTrinidad and TobagoTunisiaTurkeyTurkmenistanTuvaluUgandaUkraineUnited Arab EmiratesUnited KingdomUnited StatesUpper middle incomeUruguayUzbekistanVanuatuVenezuela, RBVietnamWest Bank and GazaWorldYemen, Rep.ZambiaZimbabwe Linea del tempo:
Questa scala temporale mostra un grafico dal 1971 anno al 2015 anno. Brazil. I dati fino ad 1970 anno non disponibili. Il numero di osservazioni attuali secondo i date: 45.
La fonte (nome):
Indicatori dello sviluppo mondiale
La fonte (organizzazione):
World Bank staff estimates using data from the United Nations Statistics Division's National Accounts Statistics.
Categorie:
Economy & Growth, Environment
sono stati aggiornati
23 apr 2017 anni
Indicatori delle variazioni dei valori per anni
Minima:
7.091
1 gen 1975 anni
Massimo:
13.391
1 gen 1991 anni
Alla data di osservazione
Valore
Variazione assoluta
La variazione rispetto al valore precedente
1 gen 1971 anni
8.11
+8.11
0.0%
1 gen 1972 anni
7.694
-0.415
-5.12%
1 gen 1973 anni
7.452
-0.243
-3.15%
1 gen 1974 anni
7.099
-0.353
-4.73%
1 gen 1975 anni
7.091
-0.008
-0.11%
1 gen 1976 anni
7.611
+0.52
7.33%
1 gen 1977 anni
7.705
+0.094
1.24%
1 gen 1978 anni
8.368
+0.663
8.6%
1 gen 1979 anni
8.728
+0.36
4.3%
1 gen 1980 anni
8.631
-0.097
-1.11%
1 gen 1981 anni
8.37
-0.261
-3.03%
1 gen 1982 anni
9.965
+1.596
19.07%
1 gen 1983 anni
11.397
+1.432
14.37%
1 gen 1984 anni
12.84
+1.443
12.66%
1 gen 1985 anni
12.72
-0.12
-0.94%
1 gen 1986 anni
11.755
-0.965
-7.58%
1 gen 1987 anni
10.032
-1.723
-14.66%
1 gen 1988 anni
10.252
+0.22
2.2%
1 gen 1989 anni
11.728
+1.476
14.39%
1 gen 1990 anni
10.247
-1.481
-12.63%
1 gen 1991 anni
13.391
+3.144
30.68%
1 gen 1992 anni
12.92
-0.471
-3.52%
1 gen 1993 anni
12.169
-0.751
-5.81%
1 gen 1994 anni
11.554
-0.615
-5.05%
1 gen 1995 anni
11.471
-0.084
-0.72%
1 gen 1996 anni
11.411
-0.059
-0.52%
1 gen 1997 anni
11.409
-0.003
-0.02%
1 gen 1998 anni
11.355
-0.054
-0.48%
1 gen 1999 anni
11.976
+0.622
5.48%
1 gen 2000 anni
12.558
+0.582
4.86%
1 gen 2001 anni
12.124
-0.435
-3.46%
1 gen 2002 anni
12.347
+0.223
1.84%
1 gen 2003 anni
12.375
+0.028
0.22%
1 gen 2004 anni
12.518
+0.143
1.16%
1 gen 2005 anni
12.014
-0.504
-4.03%
1 gen 2006 anni
11.956
-0.058
-0.48%
1 gen 2007 anni
11.772
-0.185
-1.54%
1 gen 2008 anni
11.464
-0.308
-2.61%
1 gen 2009 anni
11.405
-0.059
-0.52%
1 gen 2010 anni
12.152
+0.747
6.55%
1 gen 2011 anni
11.255
-0.897
-7.38%
1 gen 2012 anni
11.415
+0.16
1.42%
1 gen 2013 anni
11.729
+0.314
2.75%
1 gen 2014 anni
12.004
+0.275
2.34%
1 gen 2015 anni
11.831
-0.174
-1.45%
Classificazione dei paesi secondo i statistiche attuali per anni


Commenti: