29
/it/
it
AIzaSyAYiBZKx7MnpbEhh9jyipgxe19OcubqV5w
April 1, 2024
271821
Uganda
UGA
true
2
1
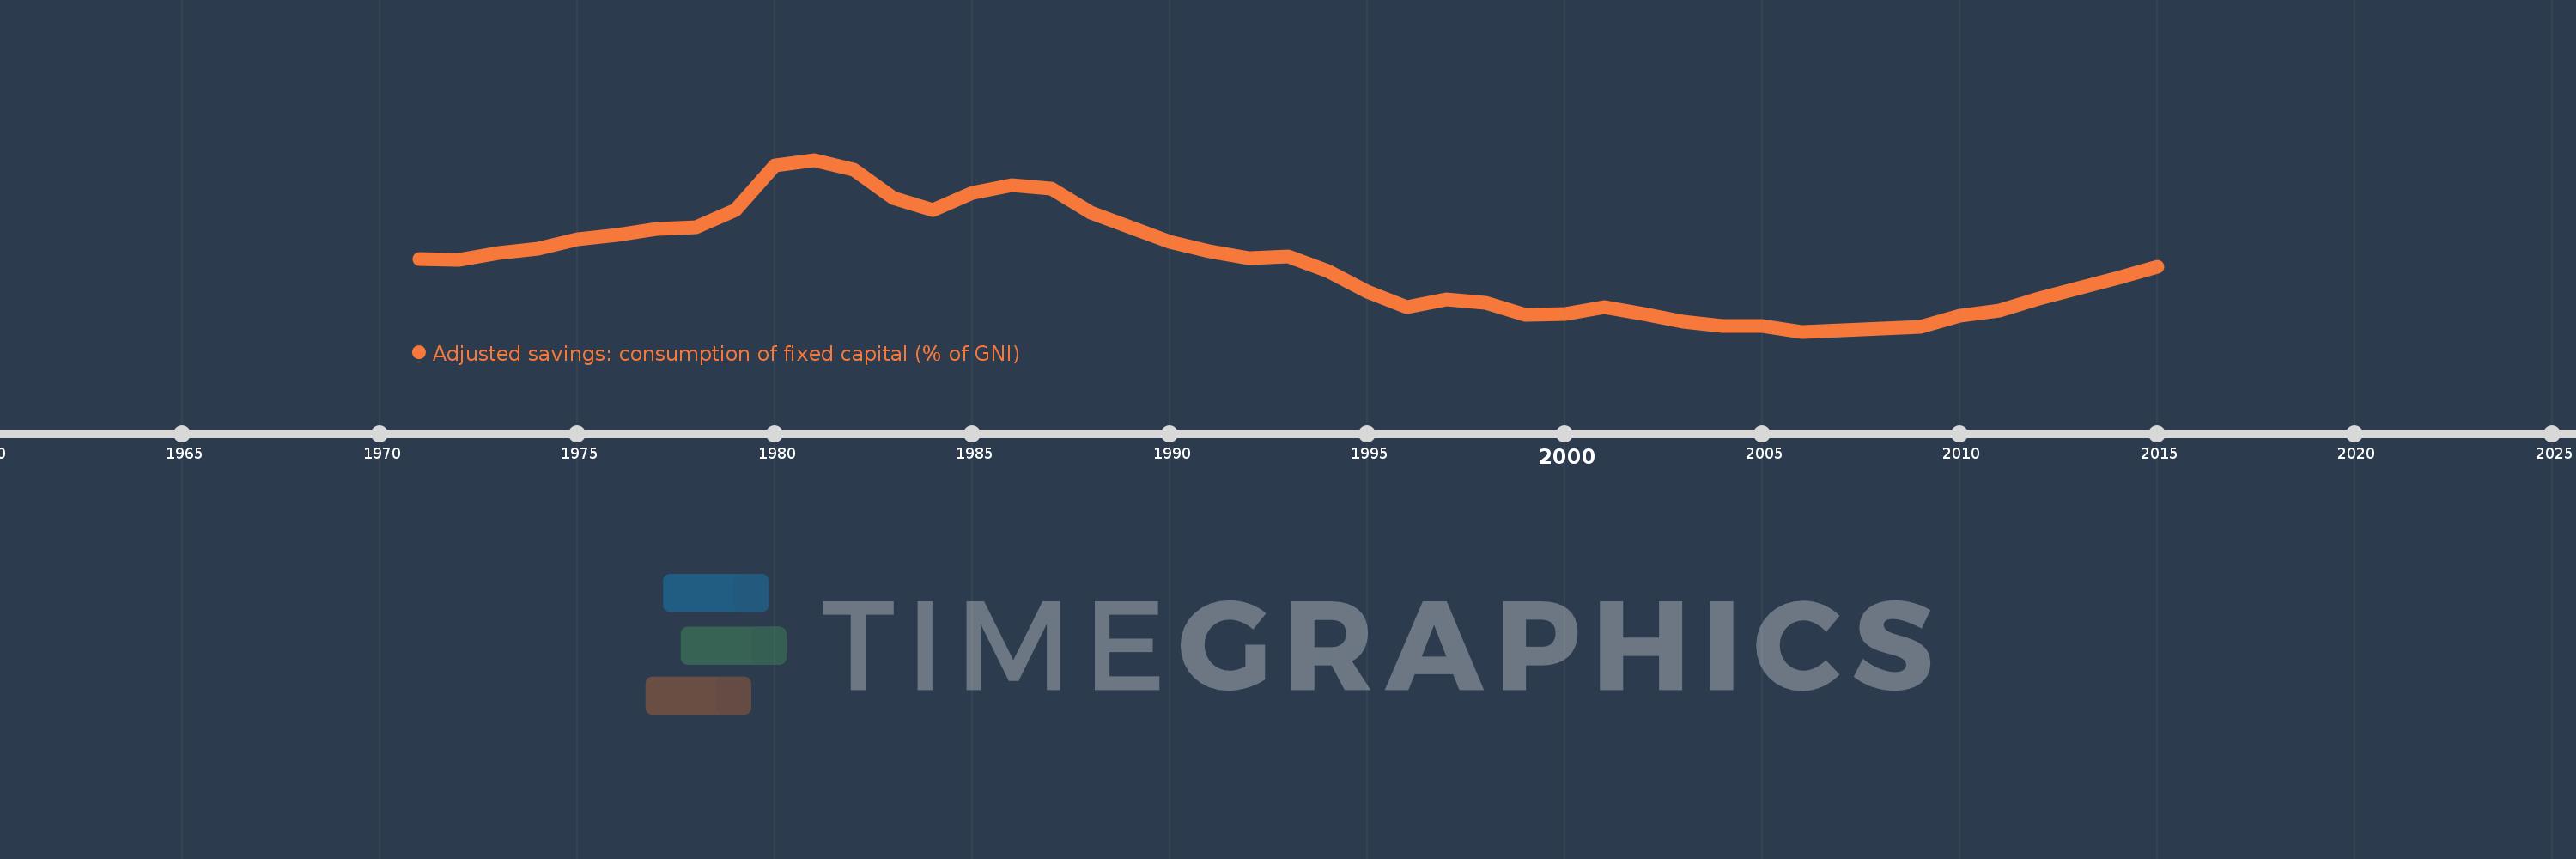
Adjusted savings: consumption of fixed capital (% of GNI)
2015,2014,2013,2012,2011,2010,2009,2008,2007,2006,2005,2004,2003,2002,2001,2000,1999,1998,1997,1996,1995,1994,1993,1992,1991,1990,1989,1988,1987,1986,1985,1984,1983,1982,1981,1980,1979,1978,1977,1976,1975,1974,1973,1972,1971
Queste statistiche in altri paesi:
AfghanistanAlbaniaAlgeriaAndorraAngolaAntigua and BarbudaArab WorldArgentinaArmeniaAustraliaAustriaAzerbaijanBahamas, TheBahrainBangladeshBarbadosBelarusBelgiumBelizeBeninBermudaBhutanBoliviaBosnia and HerzegovinaBotswanaBrazilBrunei DarussalamBulgariaBurkina FasoBurundiCabo VerdeCambodiaCameroonCanadaCaribbean small statesCentral African RepublicCentral Europe and the BalticsChadChileChinaColombiaComorosCongo, Dem. Rep.Congo, Rep.Costa RicaCote d'IvoireCroatiaCubaCyprusCzech RepublicDenmarkDjiboutiDominicaDominican RepublicEarly-demographic dividendEast Asia & PacificEast Asia & Pacific (excluding high income)East Asia & Pacific (IDA & IBRD countries)EcuadorEgypt, Arab Rep.El SalvadorEquatorial GuineaEritreaEstoniaEthiopiaEuro areaEurope & Central AsiaEurope & Central Asia (excluding high income)Europe & Central Asia (IDA & IBRD countries)European UnionFijiFinlandFragile and conflict affected situationsFranceGabonGambia, TheGeorgiaGermanyGhanaGreeceGreenlandGrenadaGuatemalaGuineaGuinea-BissauGuyanaHaitiHeavily indebted poor countries (HIPC)High incomeHondurasHong Kong SAR, ChinaHungaryIBRD onlyIcelandIDA & IBRD totalIDA blendIDA onlyIDA totalIndiaIndonesiaIran, Islamic Rep.IraqIrelandIsraelItalyJamaicaJapanJordanKazakhstanKenyaKiribatiKorea, Rep.KosovoKuwaitKyrgyz RepublicLao PDRLate-demographic dividendLatin America & Caribbean Latin America & Caribbean (excluding high income)Latin America & the Caribbean (IDA & IBRD countries)LatviaLeast developed countries: UN classificationLebanonLesothoLiberiaLibyaLiechtensteinLithuaniaLow & middle incomeLow incomeLower middle incomeLuxembourgMacao SAR, ChinaMacedonia, FYRMadagascarMalawiMalaysiaMaldivesMaliMaltaMarshall IslandsMauritaniaMauritiusMexicoMicronesia, Fed. Sts.Middle East & North AfricaMiddle East & North Africa (excluding high income)Middle East & North Africa (IDA & IBRD countries)Middle incomeMoldovaMonacoMongoliaMontenegroMoroccoMozambiqueMyanmarNamibiaNepalNetherlandsNew ZealandNicaraguaNigerNigeriaNorth AmericaNorwayOECD membersOmanOther small statesPacific island small statesPakistanPalauPanamaPapua New GuineaParaguayPeruPhilippinesPolandPortugalPost-demographic dividendPre-demographic dividendPuerto RicoQatarRomaniaRussian FederationRwandaSamoaSan MarinoSao Tome and PrincipeSaudi ArabiaSenegalSerbiaSeychellesSierra LeoneSingaporeSlovak RepublicSloveniaSmall statesSolomon IslandsSouth AfricaSouth AsiaSouth Asia (IDA & IBRD)SpainSri LankaSt. Kitts and NevisSt. LuciaSt. Vincent and the GrenadinesSub-Saharan Africa Sub-Saharan Africa (excluding high income)Sub-Saharan Africa (IDA & IBRD countries)SudanSurinameSwazilandSwedenSwitzerlandSyrian Arab RepublicTajikistanTanzaniaThailandTimor-LesteTogoTongaTrinidad and TobagoTunisiaTurkeyTurkmenistanTuvaluUgandaUkraineUnited Arab EmiratesUnited KingdomUnited StatesUpper middle incomeUruguayUzbekistanVanuatuVenezuela, RBVietnamWest Bank and GazaWorldYemen, Rep.ZambiaZimbabwe Linea del tempo:
Questa scala temporale mostra un grafico dal 1971 anno al 2015 anno. Uganda. I dati fino ad 1970 anno non disponibili. Il numero di osservazioni attuali secondo i date: 45.
La fonte (nome):
Indicatori dello sviluppo mondiale
La fonte (organizzazione):
World Bank staff estimates using data from the United Nations Statistics Division's National Accounts Statistics.
Categorie:
Economy & Growth, Environment
sono stati aggiornati
23 apr 2017 anni
Indicatori delle variazioni dei valori per anni
Minima:
4.228
1 gen 2006 anni
Massimo:
8.653
1 gen 1981 anni
Alla data di osservazione
Valore
Variazione assoluta
La variazione rispetto al valore precedente
1 gen 1971 anni
6.089
+6.089
0.0%
1 gen 1972 anni
6.065
-0.023
-0.38%
1 gen 1973 anni
6.253
+0.188
3.09%
1 gen 1974 anni
6.358
+0.105
1.68%
1 gen 1975 anni
6.617
+0.259
4.07%
1 gen 1976 anni
6.708
+0.091
1.38%
1 gen 1977 anni
6.866
+0.158
2.36%
1 gen 1978 anni
6.926
+0.059
0.87%
1 gen 1979 anni
7.354
+0.429
6.19%
1 gen 1980 anni
8.507
+1.152
15.67%
1 gen 1981 anni
8.653
+0.146
1.72%
1 gen 1982 anni
8.388
-0.265
-3.06%
1 gen 1983 anni
7.678
-0.71
-8.47%
1 gen 1984 anni
7.355
-0.323
-4.2%
1 gen 1985 anni
7.812
+0.456
6.21%
1 gen 1986 anni
8.002
+0.191
2.44%
1 gen 1987 anni
7.904
-0.098
-1.23%
1 gen 1988 anni
7.291
-0.613
-7.76%
1 gen 1989 anni
6.913
-0.378
-5.18%
1 gen 1990 anni
6.55
-0.363
-5.25%
1 gen 1991 anni
6.293
-0.257
-3.92%
1 gen 1992 anni
6.129
-0.164
-2.61%
1 gen 1993 anni
6.155
+0.027
0.43%
1 gen 1994 anni
5.783
-0.372
-6.05%
1 gen 1995 anni
5.254
-0.528
-9.14%
1 gen 1996 anni
4.851
-0.403
-7.67%
1 gen 1997 anni
5.048
+0.196
4.05%
1 gen 1998 anni
4.973
-0.074
-1.47%
1 gen 1999 anni
4.67
-0.303
-6.1%
1 gen 2000 anni
4.681
+0.011
0.23%
1 gen 2001 anni
4.868
+0.188
4.01%
1 gen 2002 anni
4.682
-0.187
-3.83%
1 gen 2003 anni
4.483
-0.199
-4.25%
1 gen 2004 anni
4.38
-0.103
-2.3%
1 gen 2005 anni
4.375
-0.005
-0.11%
1 gen 2006 anni
4.228
-0.147
-3.37%
1 gen 2007 anni
4.271
+0.043
1.01%
1 gen 2008 anni
4.299
+0.028
0.66%
1 gen 2009 anni
4.351
+0.052
1.2%
1 gen 2010 anni
4.635
+0.284
6.54%
1 gen 2011 anni
4.778
+0.143
3.09%
1 gen 2012 anni
5.085
+0.307
6.42%
1 gen 2013 anni
5.354
+0.269
5.28%
1 gen 2014 anni
5.609
+0.255
4.76%
1 gen 2015 anni
5.901
+0.293
5.22%
Classificazione dei paesi secondo i statistiche attuali per anni


Commenti: