29
/it/
it
AIzaSyAYiBZKx7MnpbEhh9jyipgxe19OcubqV5w
April 1, 2024
238901
Sierra Leone
SLE
true
2
1
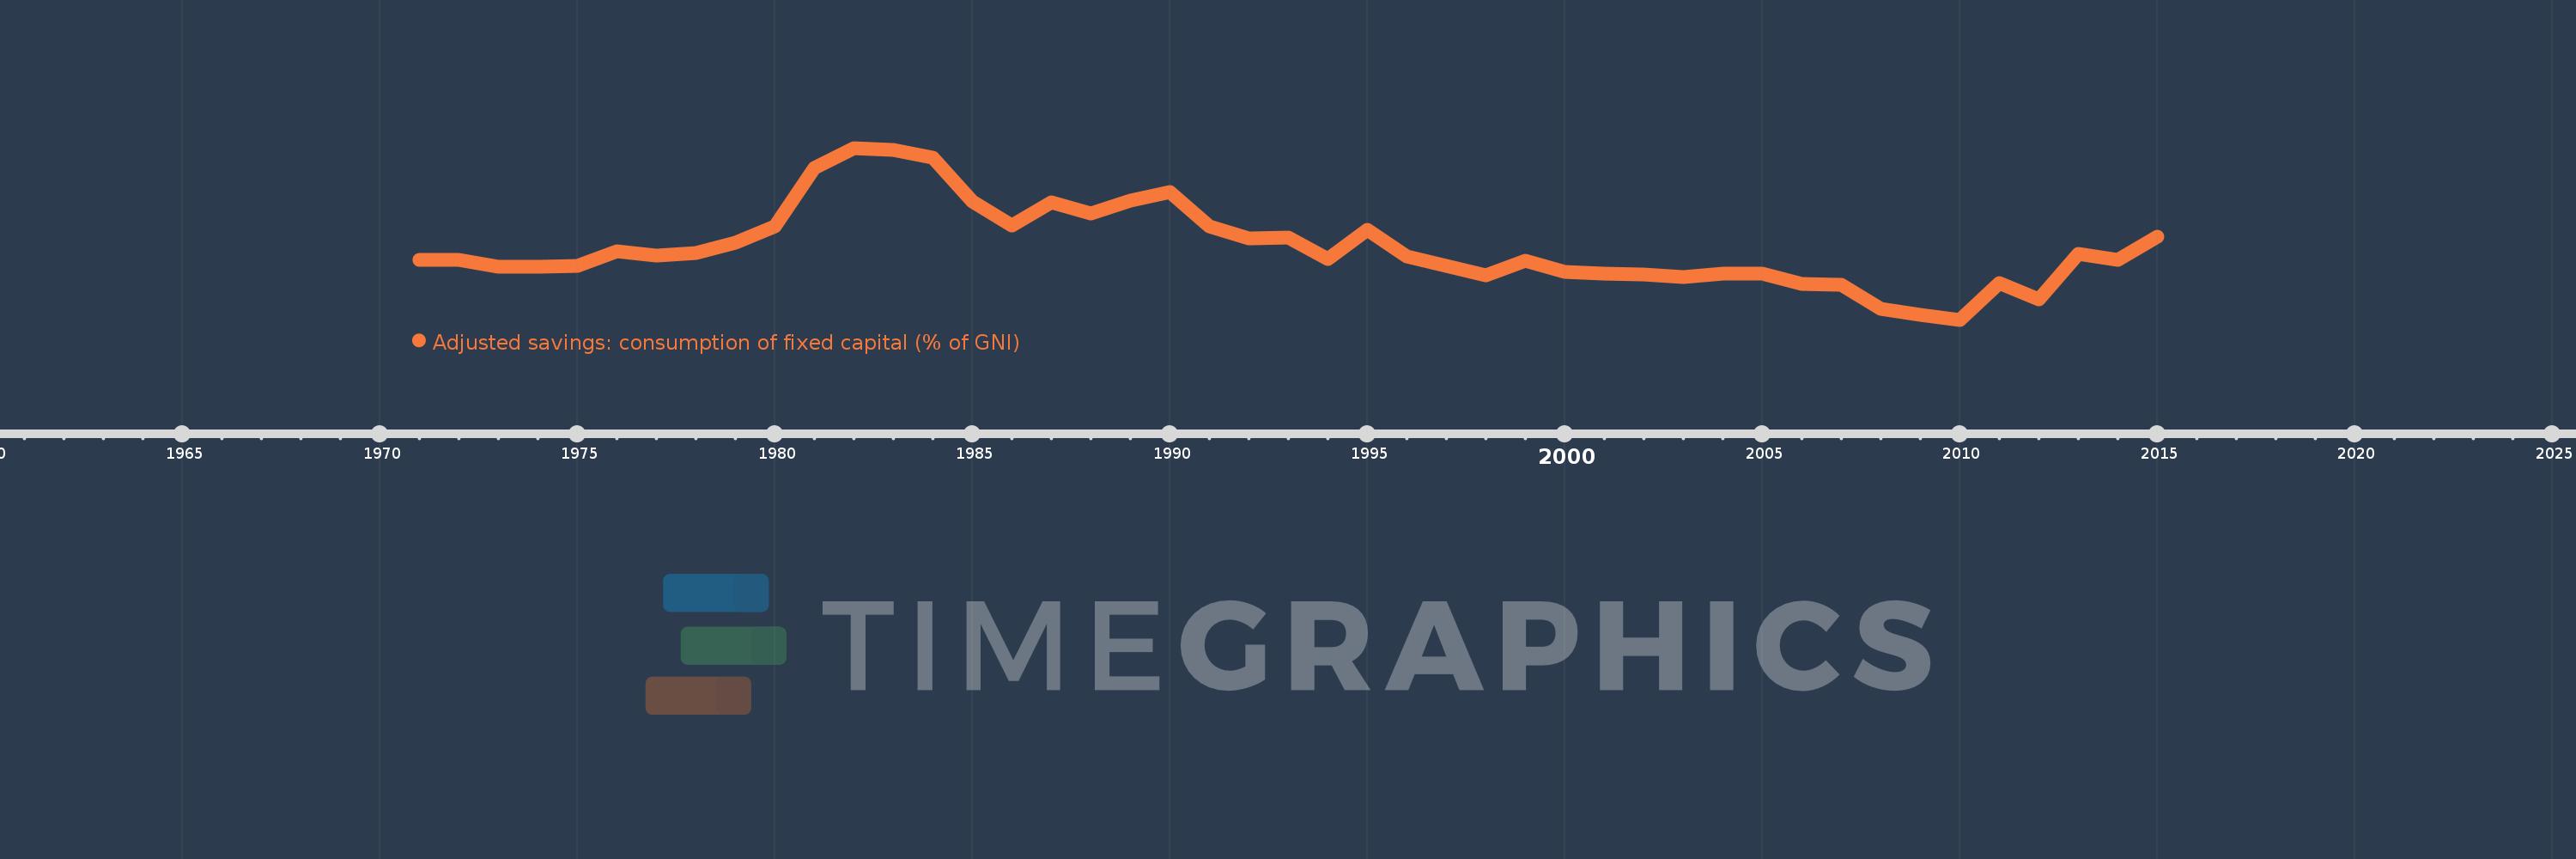
Adjusted savings: consumption of fixed capital (% of GNI)
2015,2014,2013,2012,2011,2010,2009,2008,2007,2006,2005,2004,2003,2002,2001,2000,1999,1998,1997,1996,1995,1994,1993,1992,1991,1990,1989,1988,1987,1986,1985,1984,1983,1982,1981,1980,1979,1978,1977,1976,1975,1974,1973,1972,1971
Queste statistiche in altri paesi:
AfghanistanAlbaniaAlgeriaAndorraAngolaAntigua and BarbudaArab WorldArgentinaArmeniaAustraliaAustriaAzerbaijanBahamas, TheBahrainBangladeshBarbadosBelarusBelgiumBelizeBeninBermudaBhutanBoliviaBosnia and HerzegovinaBotswanaBrazilBrunei DarussalamBulgariaBurkina FasoBurundiCabo VerdeCambodiaCameroonCanadaCaribbean small statesCentral African RepublicCentral Europe and the BalticsChadChileChinaColombiaComorosCongo, Dem. Rep.Congo, Rep.Costa RicaCote d'IvoireCroatiaCubaCyprusCzech RepublicDenmarkDjiboutiDominicaDominican RepublicEarly-demographic dividendEast Asia & PacificEast Asia & Pacific (excluding high income)East Asia & Pacific (IDA & IBRD countries)EcuadorEgypt, Arab Rep.El SalvadorEquatorial GuineaEritreaEstoniaEthiopiaEuro areaEurope & Central AsiaEurope & Central Asia (excluding high income)Europe & Central Asia (IDA & IBRD countries)European UnionFijiFinlandFragile and conflict affected situationsFranceGabonGambia, TheGeorgiaGermanyGhanaGreeceGreenlandGrenadaGuatemalaGuineaGuinea-BissauGuyanaHaitiHeavily indebted poor countries (HIPC)High incomeHondurasHong Kong SAR, ChinaHungaryIBRD onlyIcelandIDA & IBRD totalIDA blendIDA onlyIDA totalIndiaIndonesiaIran, Islamic Rep.IraqIrelandIsraelItalyJamaicaJapanJordanKazakhstanKenyaKiribatiKorea, Rep.KosovoKuwaitKyrgyz RepublicLao PDRLate-demographic dividendLatin America & Caribbean Latin America & Caribbean (excluding high income)Latin America & the Caribbean (IDA & IBRD countries)LatviaLeast developed countries: UN classificationLebanonLesothoLiberiaLibyaLiechtensteinLithuaniaLow & middle incomeLow incomeLower middle incomeLuxembourgMacao SAR, ChinaMacedonia, FYRMadagascarMalawiMalaysiaMaldivesMaliMaltaMarshall IslandsMauritaniaMauritiusMexicoMicronesia, Fed. Sts.Middle East & North AfricaMiddle East & North Africa (excluding high income)Middle East & North Africa (IDA & IBRD countries)Middle incomeMoldovaMonacoMongoliaMontenegroMoroccoMozambiqueMyanmarNamibiaNepalNetherlandsNew ZealandNicaraguaNigerNigeriaNorth AmericaNorwayOECD membersOmanOther small statesPacific island small statesPakistanPalauPanamaPapua New GuineaParaguayPeruPhilippinesPolandPortugalPost-demographic dividendPre-demographic dividendPuerto RicoQatarRomaniaRussian FederationRwandaSamoaSan MarinoSao Tome and PrincipeSaudi ArabiaSenegalSerbiaSeychellesSierra LeoneSingaporeSlovak RepublicSloveniaSmall statesSolomon IslandsSouth AfricaSouth AsiaSouth Asia (IDA & IBRD)SpainSri LankaSt. Kitts and NevisSt. LuciaSt. Vincent and the GrenadinesSub-Saharan Africa Sub-Saharan Africa (excluding high income)Sub-Saharan Africa (IDA & IBRD countries)SudanSurinameSwazilandSwedenSwitzerlandSyrian Arab RepublicTajikistanTanzaniaThailandTimor-LesteTogoTongaTrinidad and TobagoTunisiaTurkeyTurkmenistanTuvaluUgandaUkraineUnited Arab EmiratesUnited KingdomUnited StatesUpper middle incomeUruguayUzbekistanVanuatuVenezuela, RBVietnamWest Bank and GazaWorldYemen, Rep.ZambiaZimbabwe Linea del tempo:
Questa scala temporale mostra un grafico dal 1971 anno al 2015 anno. Sierra Leone. I dati fino ad 1970 anno non disponibili. Il numero di osservazioni attuali secondo i date: 45.
La fonte (nome):
Indicatori dello sviluppo mondiale
La fonte (organizzazione):
World Bank staff estimates using data from the United Nations Statistics Division's National Accounts Statistics.
Categorie:
Economy & Growth, Environment
sono stati aggiornati
23 apr 2017 anni
Indicatori delle variazioni dei valori per anni
Minima:
6.51
1 gen 2010 anni
Massimo:
9.893
1 gen 1982 anni
Alla data di osservazione
Valore
Variazione assoluta
La variazione rispetto al valore precedente
1 gen 1971 anni
7.688
+7.688
0.0%
1 gen 1972 anni
7.684
-0.004
-0.05%
1 gen 1973 anni
7.553
-0.131
-1.71%
1 gen 1974 anni
7.559
+0.006
0.08%
1 gen 1975 anni
7.571
+0.012
0.16%
1 gen 1976 anni
7.853
+0.281
3.71%
1 gen 1977 anni
7.774
-0.078
-1.0%
1 gen 1978 anni
7.821
+0.047
0.6%
1 gen 1979 anni
8.019
+0.199
2.54%
1 gen 1980 anni
8.354
+0.334
4.17%
1 gen 1981 anni
9.504
+1.151
13.77%
1 gen 1982 anni
9.893
+0.388
4.09%
1 gen 1983 anni
9.861
-0.031
-0.32%
1 gen 1984 anni
9.707
-0.154
-1.56%
1 gen 1985 anni
8.834
-0.873
-9.0%
1 gen 1986 anni
8.361
-0.472
-5.35%
1 gen 1987 anni
8.83
+0.468
5.6%
1 gen 1988 anni
8.598
-0.232
-2.63%
1 gen 1989 anni
8.851
+0.254
2.95%
1 gen 1990 anni
9.018
+0.167
1.88%
1 gen 1991 anni
8.356
-0.663
-7.35%
1 gen 1992 anni
8.108
-0.248
-2.96%
1 gen 1993 anni
8.131
+0.023
0.28%
1 gen 1994 anni
7.705
-0.426
-5.24%
1 gen 1995 anni
8.279
+0.574
7.45%
1 gen 1996 anni
7.763
-0.516
-6.24%
1 gen 1997 anni
7.575
-0.187
-2.41%
1 gen 1998 anni
7.38
-0.196
-2.58%
1 gen 1999 anni
7.672
+0.292
3.96%
1 gen 2000 anni
7.459
-0.213
-2.77%
1 gen 2001 anni
7.423
-0.036
-0.48%
1 gen 2002 anni
7.395
-0.028
-0.38%
1 gen 2003 anni
7.358
-0.036
-0.49%
1 gen 2004 anni
7.425
+0.066
0.9%
1 gen 2005 anni
7.423
-0.001
-0.02%
1 gen 2006 anni
7.207
-0.216
-2.91%
1 gen 2007 anni
7.198
-0.009
-0.13%
1 gen 2008 anni
6.719
-0.479
-6.65%
1 gen 2009 anni
6.602
-0.118
-1.75%
1 gen 2010 anni
6.51
-0.092
-1.39%
1 gen 2011 anni
7.231
+0.721
11.08%
1 gen 2012 anni
6.918
-0.313
-4.33%
1 gen 2013 anni
7.81
+0.892
12.89%
1 gen 2014 anni
7.69
-0.119
-1.53%
1 gen 2015 anni
8.15
+0.46
5.98%
Classificazione dei paesi secondo i statistiche attuali per anni


Commenti: