29
/it/
it
AIzaSyAYiBZKx7MnpbEhh9jyipgxe19OcubqV5w
April 1, 2024
275381
United Kingdom
GBR
true
2
1
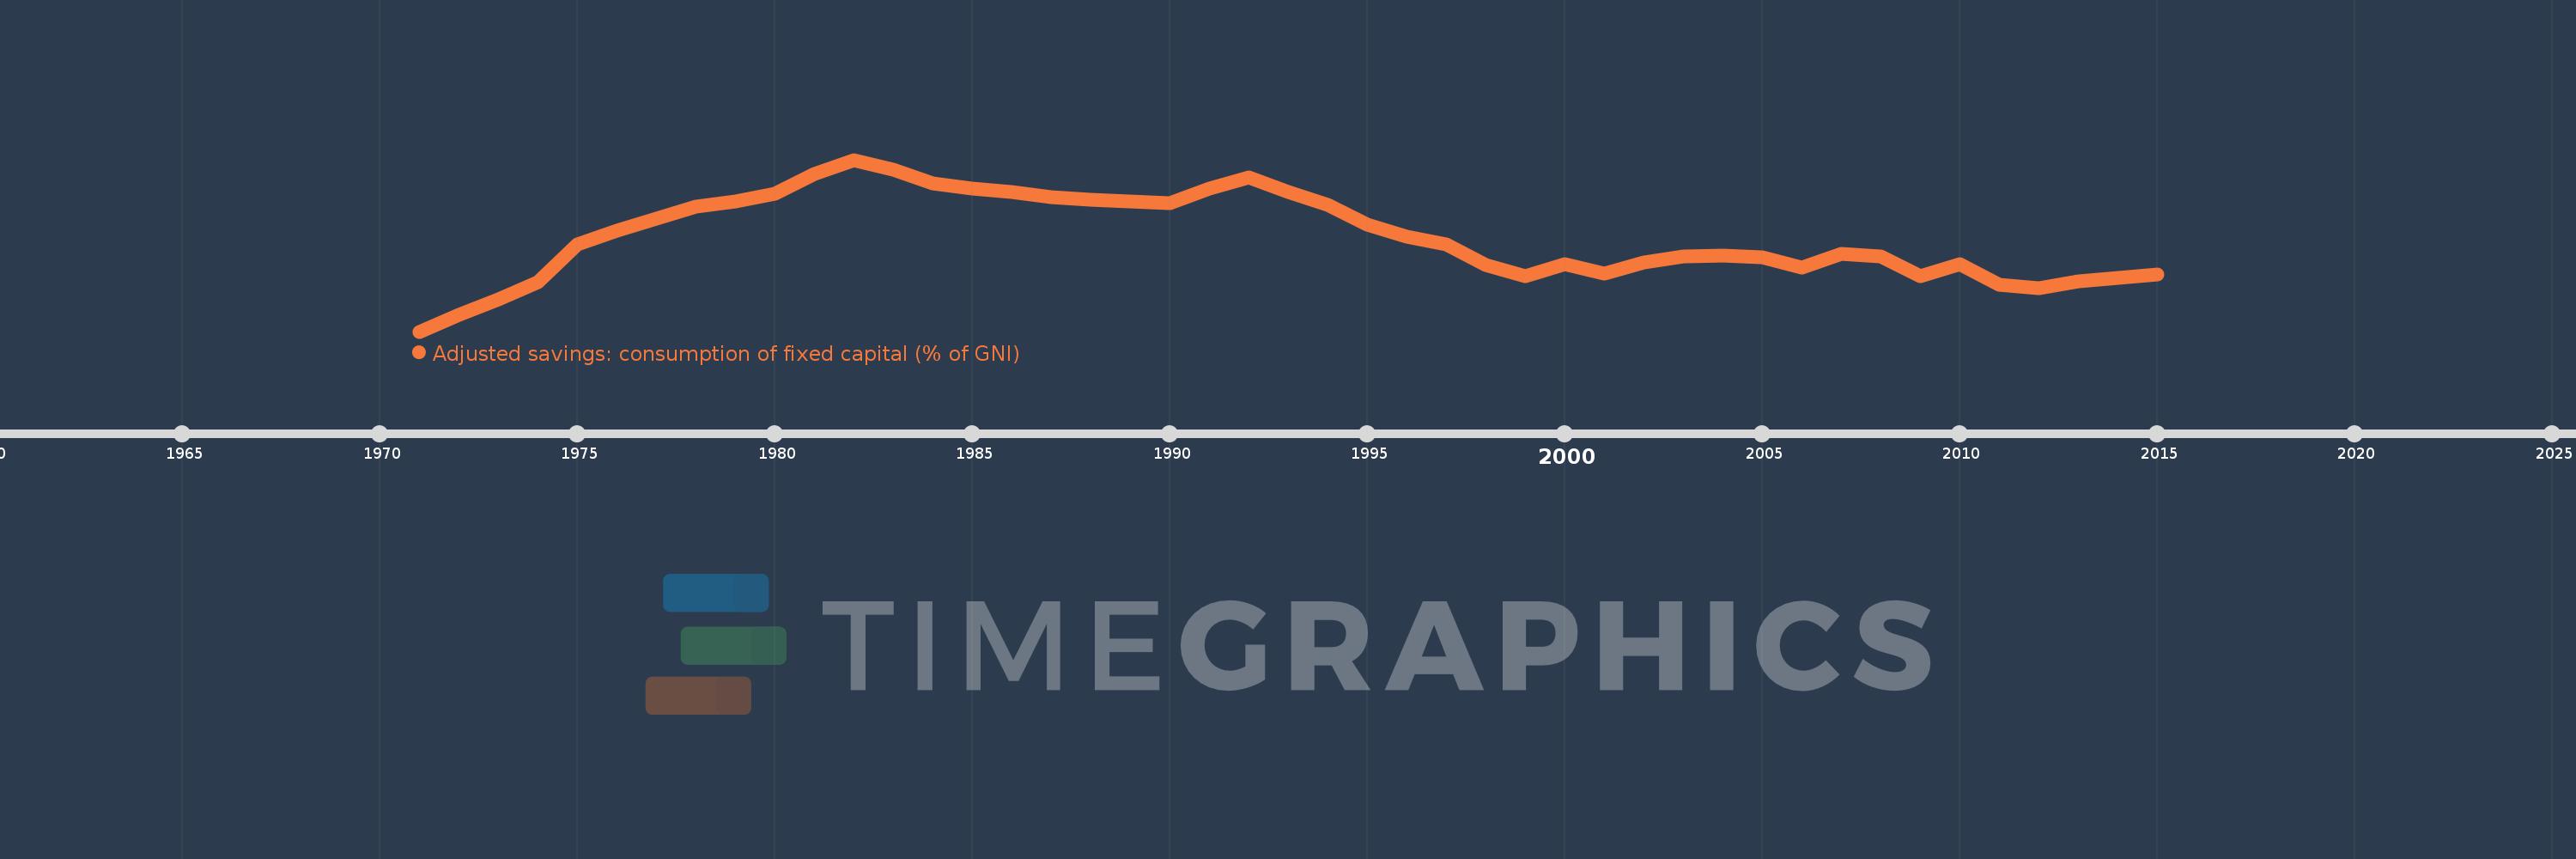
Adjusted savings: consumption of fixed capital (% of GNI)
2015,2014,2013,2012,2011,2010,2009,2008,2007,2006,2005,2004,2003,2002,2001,2000,1999,1998,1997,1996,1995,1994,1993,1992,1991,1990,1989,1988,1987,1986,1985,1984,1983,1982,1981,1980,1979,1978,1977,1976,1975,1974,1973,1972,1971
Queste statistiche in altri paesi:
AfghanistanAlbaniaAlgeriaAndorraAngolaAntigua and BarbudaArab WorldArgentinaArmeniaAustraliaAustriaAzerbaijanBahamas, TheBahrainBangladeshBarbadosBelarusBelgiumBelizeBeninBermudaBhutanBoliviaBosnia and HerzegovinaBotswanaBrazilBrunei DarussalamBulgariaBurkina FasoBurundiCabo VerdeCambodiaCameroonCanadaCaribbean small statesCentral African RepublicCentral Europe and the BalticsChadChileChinaColombiaComorosCongo, Dem. Rep.Congo, Rep.Costa RicaCote d'IvoireCroatiaCubaCyprusCzech RepublicDenmarkDjiboutiDominicaDominican RepublicEarly-demographic dividendEast Asia & PacificEast Asia & Pacific (excluding high income)East Asia & Pacific (IDA & IBRD countries)EcuadorEgypt, Arab Rep.El SalvadorEquatorial GuineaEritreaEstoniaEthiopiaEuro areaEurope & Central AsiaEurope & Central Asia (excluding high income)Europe & Central Asia (IDA & IBRD countries)European UnionFijiFinlandFragile and conflict affected situationsFranceGabonGambia, TheGeorgiaGermanyGhanaGreeceGreenlandGrenadaGuatemalaGuineaGuinea-BissauGuyanaHaitiHeavily indebted poor countries (HIPC)High incomeHondurasHong Kong SAR, ChinaHungaryIBRD onlyIcelandIDA & IBRD totalIDA blendIDA onlyIDA totalIndiaIndonesiaIran, Islamic Rep.IraqIrelandIsraelItalyJamaicaJapanJordanKazakhstanKenyaKiribatiKorea, Rep.KosovoKuwaitKyrgyz RepublicLao PDRLate-demographic dividendLatin America & Caribbean Latin America & Caribbean (excluding high income)Latin America & the Caribbean (IDA & IBRD countries)LatviaLeast developed countries: UN classificationLebanonLesothoLiberiaLibyaLiechtensteinLithuaniaLow & middle incomeLow incomeLower middle incomeLuxembourgMacao SAR, ChinaMacedonia, FYRMadagascarMalawiMalaysiaMaldivesMaliMaltaMarshall IslandsMauritaniaMauritiusMexicoMicronesia, Fed. Sts.Middle East & North AfricaMiddle East & North Africa (excluding high income)Middle East & North Africa (IDA & IBRD countries)Middle incomeMoldovaMonacoMongoliaMontenegroMoroccoMozambiqueMyanmarNamibiaNepalNetherlandsNew ZealandNicaraguaNigerNigeriaNorth AmericaNorwayOECD membersOmanOther small statesPacific island small statesPakistanPalauPanamaPapua New GuineaParaguayPeruPhilippinesPolandPortugalPost-demographic dividendPre-demographic dividendPuerto RicoQatarRomaniaRussian FederationRwandaSamoaSan MarinoSao Tome and PrincipeSaudi ArabiaSenegalSerbiaSeychellesSierra LeoneSingaporeSlovak RepublicSloveniaSmall statesSolomon IslandsSouth AfricaSouth AsiaSouth Asia (IDA & IBRD)SpainSri LankaSt. Kitts and NevisSt. LuciaSt. Vincent and the GrenadinesSub-Saharan Africa Sub-Saharan Africa (excluding high income)Sub-Saharan Africa (IDA & IBRD countries)SudanSurinameSwazilandSwedenSwitzerlandSyrian Arab RepublicTajikistanTanzaniaThailandTimor-LesteTogoTongaTrinidad and TobagoTunisiaTurkeyTurkmenistanTuvaluUgandaUkraineUnited Arab EmiratesUnited KingdomUnited StatesUpper middle incomeUruguayUzbekistanVanuatuVenezuela, RBVietnamWest Bank and GazaWorldYemen, Rep.ZambiaZimbabwe Linea del tempo:
Questa scala temporale mostra un grafico dal 1971 anno al 2015 anno. United Kingdom. I dati fino ad 1970 anno non disponibili. Il numero di osservazioni attuali secondo i date: 45.
La fonte (nome):
Indicatori dello sviluppo mondiale
La fonte (organizzazione):
World Bank staff estimates using data from the United Nations Statistics Division's National Accounts Statistics.
Categorie:
Economy & Growth, Environment
sono stati aggiornati
23 apr 2017 anni
Indicatori delle variazioni dei valori per anni
Minima:
11.759
1 gen 1971 anni
Massimo:
17.101
1 gen 1982 anni
Alla data di osservazione
Valore
Variazione assoluta
La variazione rispetto al valore precedente
1 gen 1971 anni
11.759
+11.759
0.0%
1 gen 1972 anni
12.286
+0.527
4.48%
1 gen 1973 anni
12.771
+0.486
3.95%
1 gen 1974 anni
13.288
+0.516
4.04%
1 gen 1975 anni
14.464
+1.176
8.85%
1 gen 1976 anni
14.91
+0.446
3.08%
1 gen 1977 anni
15.277
+0.368
2.47%
1 gen 1978 anni
15.657
+0.38
2.49%
1 gen 1979 anni
15.807
+0.15
0.96%
1 gen 1980 anni
16.054
+0.247
1.56%
1 gen 1981 anni
16.661
+0.607
3.78%
1 gen 1982 anni
17.101
+0.439
2.64%
1 gen 1983 anni
16.807
-0.293
-1.71%
1 gen 1984 anni
16.374
-0.433
-2.58%
1 gen 1985 anni
16.205
-0.169
-1.03%
1 gen 1986 anni
16.093
-0.113
-0.7%
1 gen 1987 anni
15.944
-0.149
-0.92%
1 gen 1988 anni
15.864
-0.08
-0.5%
1 gen 1989 anni
15.815
-0.049
-0.31%
1 gen 1990 anni
15.754
-0.061
-0.39%
1 gen 1991 anni
16.201
+0.447
2.84%
1 gen 1992 anni
16.554
+0.354
2.18%
1 gen 1993 anni
16.092
-0.462
-2.79%
1 gen 1994 anni
15.702
-0.39
-2.42%
1 gen 1995 anni
15.084
-0.618
-3.94%
1 gen 1996 anni
14.714
-0.37
-2.45%
1 gen 1997 anni
14.468
-0.246
-1.67%
1 gen 1998 anni
13.841
-0.627
-4.33%
1 gen 1999 anni
13.469
-0.372
-2.69%
1 gen 2000 anni
13.866
+0.396
2.94%
1 gen 2001 anni
13.571
-0.295
-2.13%
1 gen 2002 anni
13.902
+0.331
2.44%
1 gen 2003 anni
14.087
+0.186
1.33%
1 gen 2004 anni
14.129
+0.041
0.29%
1 gen 2005 anni
14.071
-0.057
-0.41%
1 gen 2006 anni
13.762
-0.31
-2.2%
1 gen 2007 anni
14.179
+0.417
3.03%
1 gen 2008 anni
14.106
-0.073
-0.51%
1 gen 2009 anni
13.471
-0.635
-4.5%
1 gen 2010 anni
13.857
+0.386
2.87%
1 gen 2011 anni
13.226
-0.632
-4.56%
1 gen 2012 anni
13.106
-0.12
-0.9%
1 gen 2013 anni
13.317
+0.21
1.61%
1 gen 2014 anni
13.44
+0.123
0.93%
1 gen 2015 anni
13.531
+0.091
0.68%
Classificazione dei paesi secondo i statistiche attuali per anni


Commenti: