29
/it/
it
AIzaSyAYiBZKx7MnpbEhh9jyipgxe19OcubqV5w
April 1, 2024
219261
Papua New Guinea
PNG
true
2
1
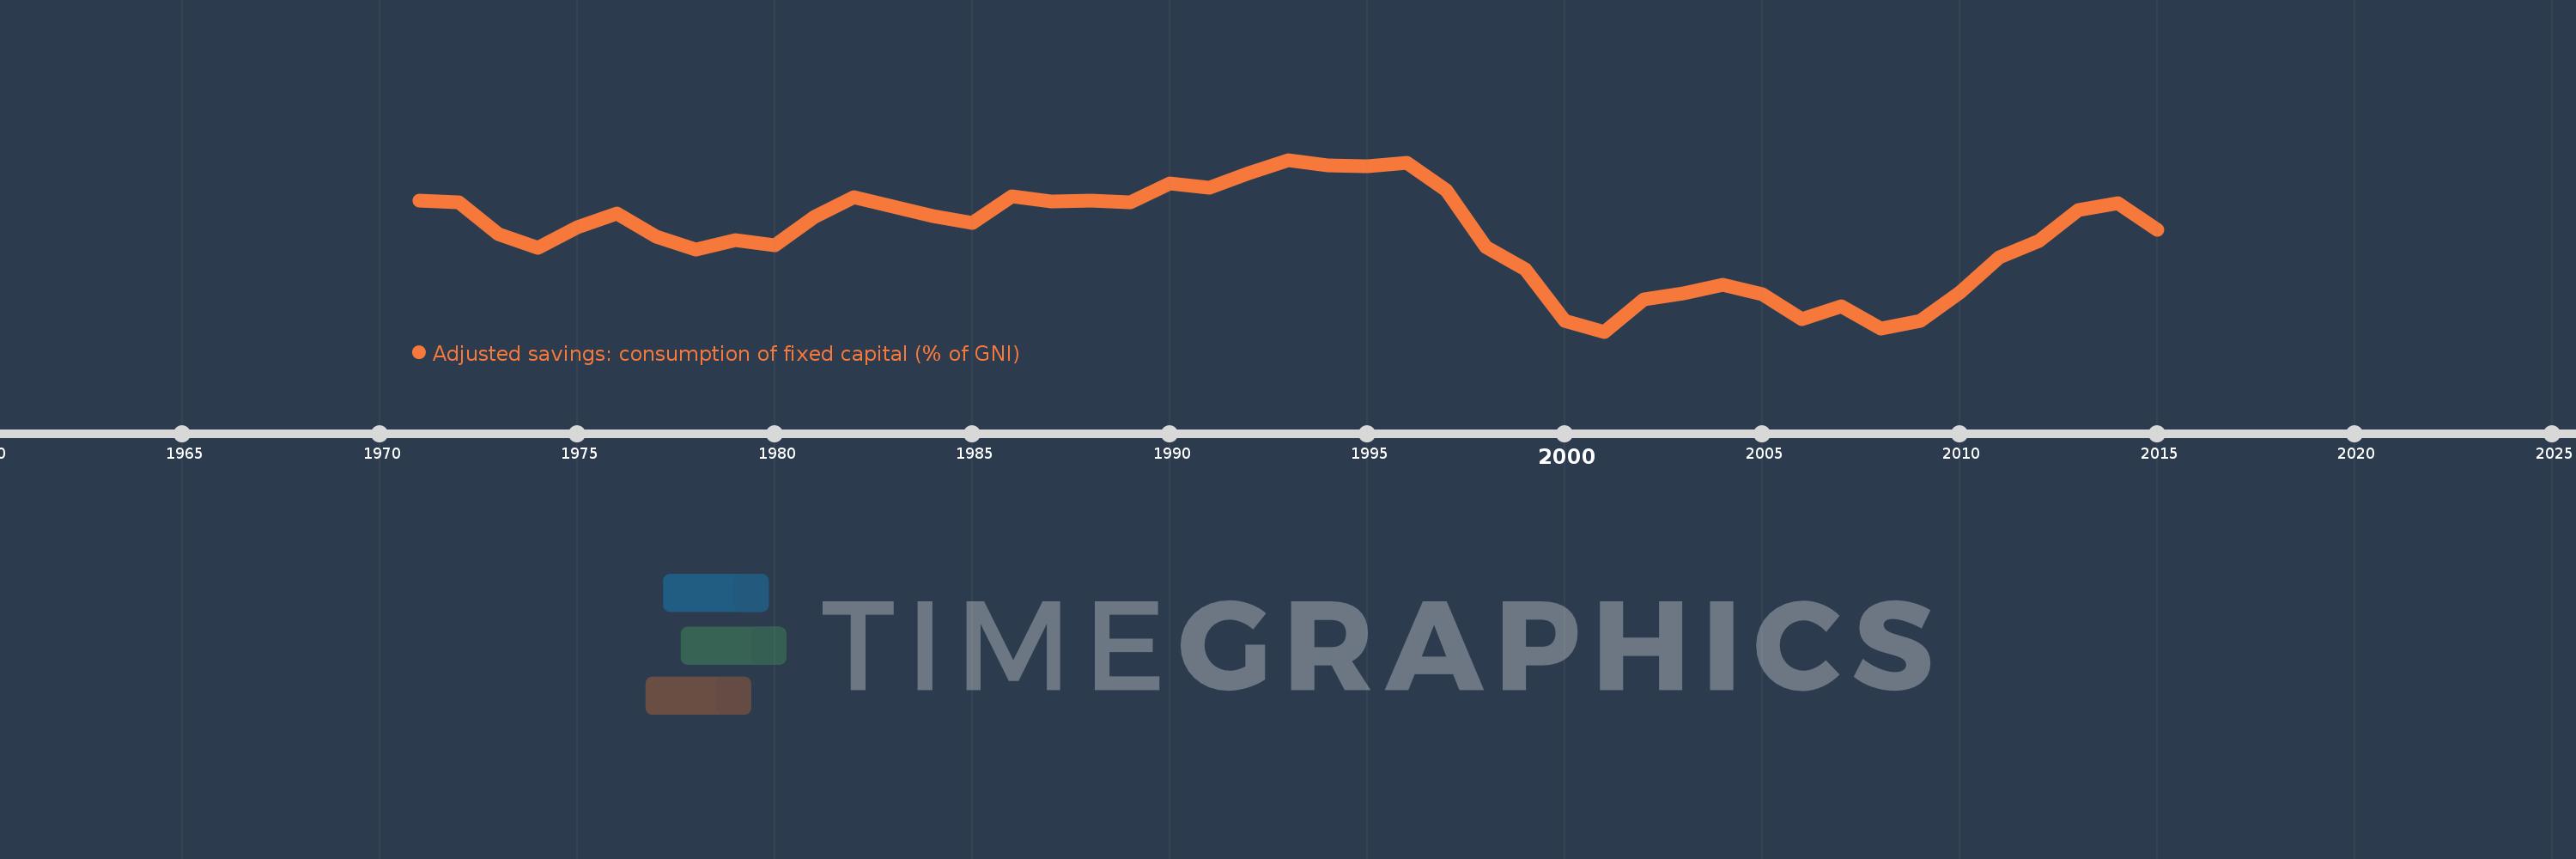
Adjusted savings: consumption of fixed capital (% of GNI)
2015,2014,2013,2012,2011,2010,2009,2008,2007,2006,2005,2004,2003,2002,2001,2000,1999,1998,1997,1996,1995,1994,1993,1992,1991,1990,1989,1988,1987,1986,1985,1984,1983,1982,1981,1980,1979,1978,1977,1976,1975,1974,1973,1972,1971
Queste statistiche in altri paesi:
AfghanistanAlbaniaAlgeriaAndorraAngolaAntigua and BarbudaArab WorldArgentinaArmeniaAustraliaAustriaAzerbaijanBahamas, TheBahrainBangladeshBarbadosBelarusBelgiumBelizeBeninBermudaBhutanBoliviaBosnia and HerzegovinaBotswanaBrazilBrunei DarussalamBulgariaBurkina FasoBurundiCabo VerdeCambodiaCameroonCanadaCaribbean small statesCentral African RepublicCentral Europe and the BalticsChadChileChinaColombiaComorosCongo, Dem. Rep.Congo, Rep.Costa RicaCote d'IvoireCroatiaCubaCyprusCzech RepublicDenmarkDjiboutiDominicaDominican RepublicEarly-demographic dividendEast Asia & PacificEast Asia & Pacific (excluding high income)East Asia & Pacific (IDA & IBRD countries)EcuadorEgypt, Arab Rep.El SalvadorEquatorial GuineaEritreaEstoniaEthiopiaEuro areaEurope & Central AsiaEurope & Central Asia (excluding high income)Europe & Central Asia (IDA & IBRD countries)European UnionFijiFinlandFragile and conflict affected situationsFranceGabonGambia, TheGeorgiaGermanyGhanaGreeceGreenlandGrenadaGuatemalaGuineaGuinea-BissauGuyanaHaitiHeavily indebted poor countries (HIPC)High incomeHondurasHong Kong SAR, ChinaHungaryIBRD onlyIcelandIDA & IBRD totalIDA blendIDA onlyIDA totalIndiaIndonesiaIran, Islamic Rep.IraqIrelandIsraelItalyJamaicaJapanJordanKazakhstanKenyaKiribatiKorea, Rep.KosovoKuwaitKyrgyz RepublicLao PDRLate-demographic dividendLatin America & Caribbean Latin America & Caribbean (excluding high income)Latin America & the Caribbean (IDA & IBRD countries)LatviaLeast developed countries: UN classificationLebanonLesothoLiberiaLibyaLiechtensteinLithuaniaLow & middle incomeLow incomeLower middle incomeLuxembourgMacao SAR, ChinaMacedonia, FYRMadagascarMalawiMalaysiaMaldivesMaliMaltaMarshall IslandsMauritaniaMauritiusMexicoMicronesia, Fed. Sts.Middle East & North AfricaMiddle East & North Africa (excluding high income)Middle East & North Africa (IDA & IBRD countries)Middle incomeMoldovaMonacoMongoliaMontenegroMoroccoMozambiqueMyanmarNamibiaNepalNetherlandsNew ZealandNicaraguaNigerNigeriaNorth AmericaNorwayOECD membersOmanOther small statesPacific island small statesPakistanPalauPanamaPapua New GuineaParaguayPeruPhilippinesPolandPortugalPost-demographic dividendPre-demographic dividendPuerto RicoQatarRomaniaRussian FederationRwandaSamoaSan MarinoSao Tome and PrincipeSaudi ArabiaSenegalSerbiaSeychellesSierra LeoneSingaporeSlovak RepublicSloveniaSmall statesSolomon IslandsSouth AfricaSouth AsiaSouth Asia (IDA & IBRD)SpainSri LankaSt. Kitts and NevisSt. LuciaSt. Vincent and the GrenadinesSub-Saharan Africa Sub-Saharan Africa (excluding high income)Sub-Saharan Africa (IDA & IBRD countries)SudanSurinameSwazilandSwedenSwitzerlandSyrian Arab RepublicTajikistanTanzaniaThailandTimor-LesteTogoTongaTrinidad and TobagoTunisiaTurkeyTurkmenistanTuvaluUgandaUkraineUnited Arab EmiratesUnited KingdomUnited StatesUpper middle incomeUruguayUzbekistanVanuatuVenezuela, RBVietnamWest Bank and GazaWorldYemen, Rep.ZambiaZimbabwe Linea del tempo:
Questa scala temporale mostra un grafico dal 1971 anno al 2015 anno. Papua New Guinea. I dati fino ad 1970 anno non disponibili. Il numero di osservazioni attuali secondo i date: 45.
La fonte (nome):
Indicatori dello sviluppo mondiale
La fonte (organizzazione):
World Bank staff estimates using data from the United Nations Statistics Division's National Accounts Statistics.
Categorie:
Economy & Growth, Environment
sono stati aggiornati
23 apr 2017 anni
Indicatori delle variazioni dei valori per anni
Minima:
5.969
1 gen 2001 anni
Massimo:
9.757
1 gen 1993 anni
Alla data di osservazione
Valore
Variazione assoluta
La variazione rispetto al valore precedente
1 gen 1971 anni
8.848
+8.848
0.0%
1 gen 1972 anni
8.824
-0.024
-0.27%
1 gen 1973 anni
8.121
-0.703
-7.97%
1 gen 1974 anni
7.825
-0.295
-3.64%
1 gen 1975 anni
8.278
+0.452
5.78%
1 gen 1976 anni
8.566
+0.289
3.49%
1 gen 1977 anni
8.062
-0.505
-5.89%
1 gen 1978 anni
7.772
-0.29
-3.6%
1 gen 1979 anni
7.989
+0.217
2.79%
1 gen 1980 anni
7.878
-0.111
-1.39%
1 gen 1981 anni
8.495
+0.617
7.83%
1 gen 1982 anni
8.942
+0.447
5.26%
1 gen 1983 anni
8.728
-0.215
-2.4%
1 gen 1984 anni
8.519
-0.209
-2.39%
1 gen 1985 anni
8.371
-0.147
-1.73%
1 gen 1986 anni
8.946
+0.575
6.87%
1 gen 1987 anni
8.836
-0.11
-1.23%
1 gen 1988 anni
8.865
+0.029
0.33%
1 gen 1989 anni
8.814
-0.051
-0.57%
1 gen 1990 anni
9.236
+0.421
4.78%
1 gen 1991 anni
9.141
-0.095
-1.02%
1 gen 1992 anni
9.468
+0.327
3.58%
1 gen 1993 anni
9.757
+0.288
3.05%
1 gen 1994 anni
9.625
-0.131
-1.35%
1 gen 1995 anni
9.608
-0.017
-0.18%
1 gen 1996 anni
9.693
+0.084
0.88%
1 gen 1997 anni
9.08
-0.612
-6.32%
1 gen 1998 anni
7.835
-1.246
-13.72%
1 gen 1999 anni
7.338
-0.496
-6.34%
1 gen 2000 anni
6.214
-1.124
-15.32%
1 gen 2001 anni
5.969
-0.245
-3.94%
1 gen 2002 anni
6.677
+0.708
11.86%
1 gen 2003 anni
6.806
+0.129
1.93%
1 gen 2004 anni
7.004
+0.198
2.91%
1 gen 2005 anni
6.796
-0.209
-2.98%
1 gen 2006 anni
6.242
-0.554
-8.15%
1 gen 2007 anni
6.528
+0.286
4.58%
1 gen 2008 anni
6.036
-0.492
-7.54%
1 gen 2009 anni
6.204
+0.168
2.79%
1 gen 2010 anni
6.831
+0.627
10.11%
1 gen 2011 anni
7.611
+0.78
11.42%
1 gen 2012 anni
7.958
+0.347
4.56%
1 gen 2013 anni
8.649
+0.69
8.67%
1 gen 2014 anni
8.805
+0.156
1.81%
1 gen 2015 anni
8.217
-0.588
-6.67%
Classificazione dei paesi secondo i statistiche attuali per anni


Commenti: