29
/it/
it
AIzaSyAYiBZKx7MnpbEhh9jyipgxe19OcubqV5w
April 1, 2024
136349
Gambia, The
GMB
true
2
1
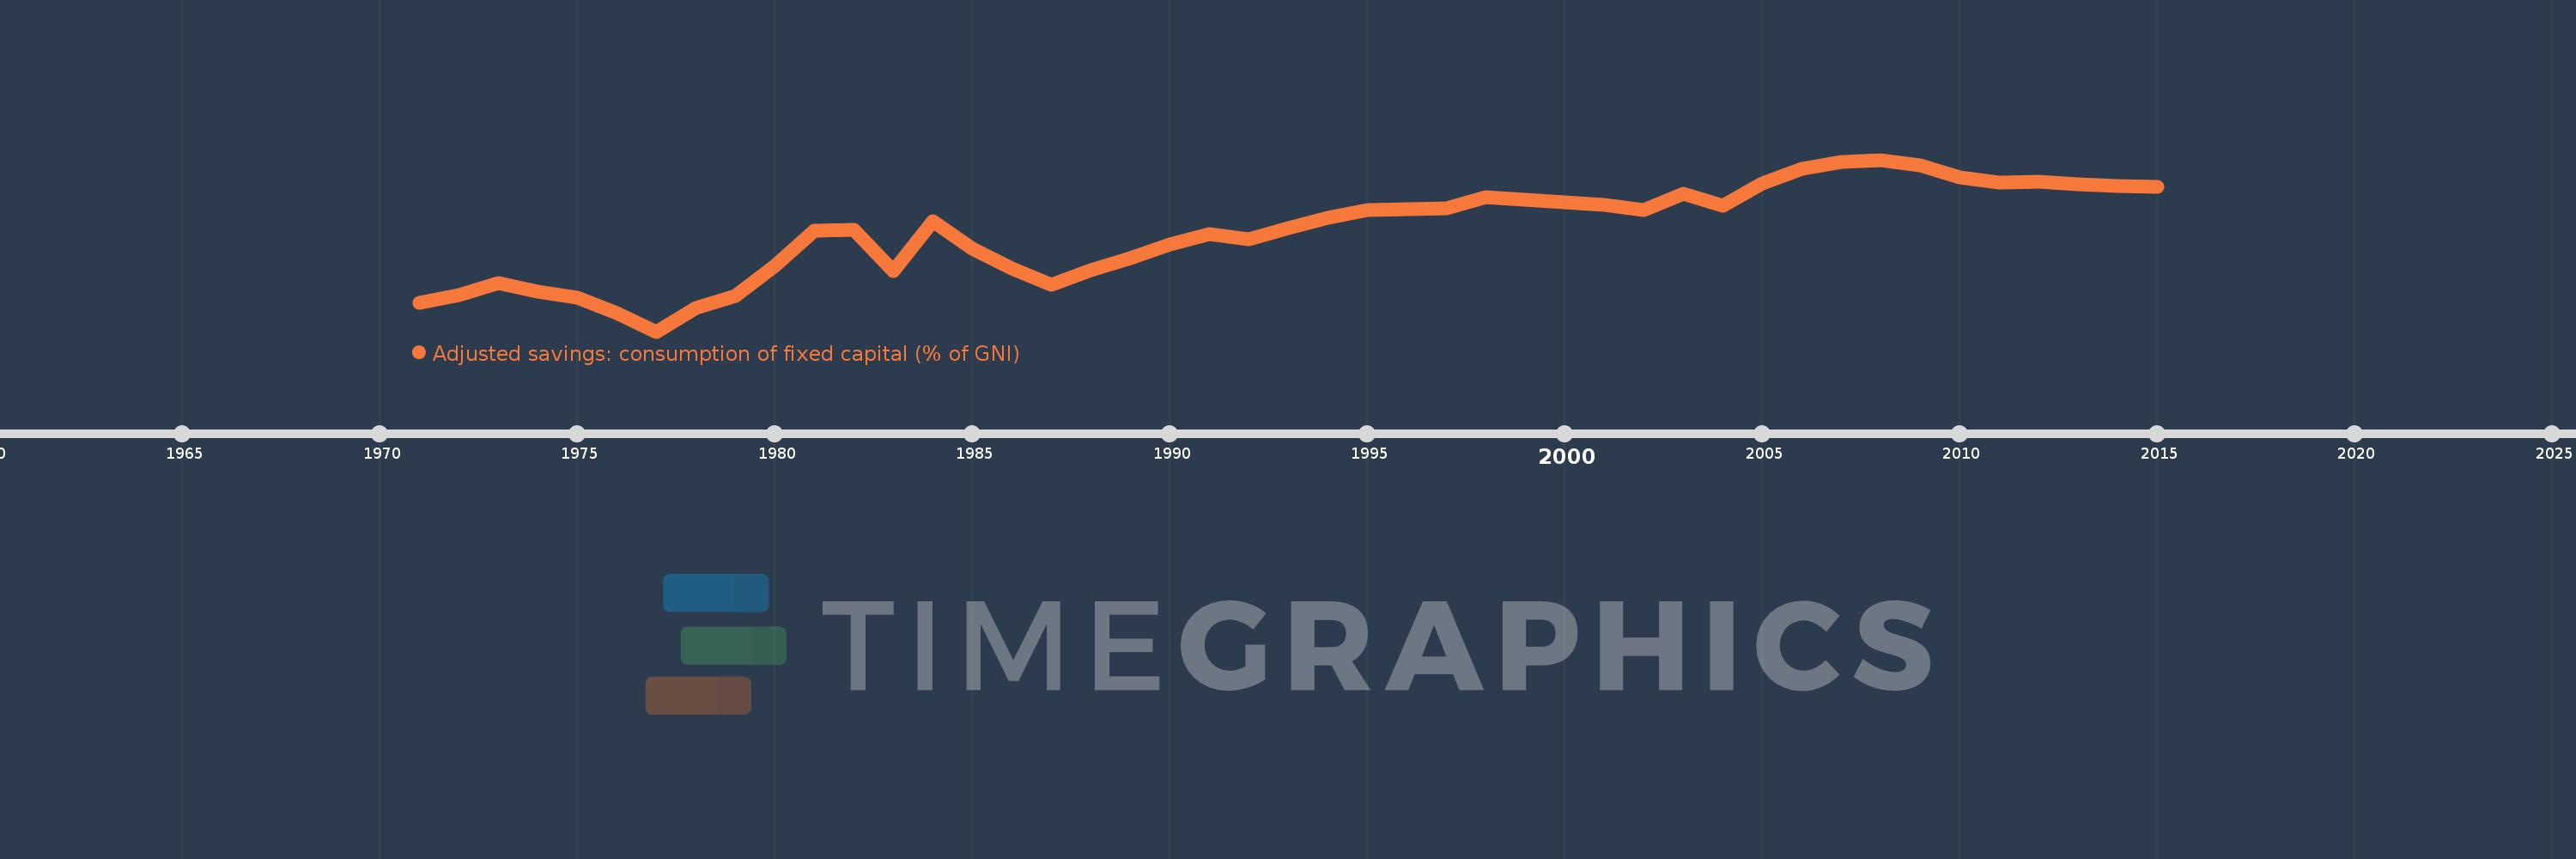
Adjusted savings: consumption of fixed capital (% of GNI)
2015,2014,2013,2012,2011,2010,2009,2008,2007,2006,2005,2004,2003,2002,2001,2000,1999,1998,1997,1996,1995,1994,1993,1992,1991,1990,1989,1988,1987,1986,1985,1984,1983,1982,1981,1980,1979,1978,1977,1976,1975,1974,1973,1972,1971
Queste statistiche in altri paesi:
AfghanistanAlbaniaAlgeriaAndorraAngolaAntigua and BarbudaArab WorldArgentinaArmeniaAustraliaAustriaAzerbaijanBahamas, TheBahrainBangladeshBarbadosBelarusBelgiumBelizeBeninBermudaBhutanBoliviaBosnia and HerzegovinaBotswanaBrazilBrunei DarussalamBulgariaBurkina FasoBurundiCabo VerdeCambodiaCameroonCanadaCaribbean small statesCentral African RepublicCentral Europe and the BalticsChadChileChinaColombiaComorosCongo, Dem. Rep.Congo, Rep.Costa RicaCote d'IvoireCroatiaCubaCyprusCzech RepublicDenmarkDjiboutiDominicaDominican RepublicEarly-demographic dividendEast Asia & PacificEast Asia & Pacific (excluding high income)East Asia & Pacific (IDA & IBRD countries)EcuadorEgypt, Arab Rep.El SalvadorEquatorial GuineaEritreaEstoniaEthiopiaEuro areaEurope & Central AsiaEurope & Central Asia (excluding high income)Europe & Central Asia (IDA & IBRD countries)European UnionFijiFinlandFragile and conflict affected situationsFranceGabonGambia, TheGeorgiaGermanyGhanaGreeceGreenlandGrenadaGuatemalaGuineaGuinea-BissauGuyanaHaitiHeavily indebted poor countries (HIPC)High incomeHondurasHong Kong SAR, ChinaHungaryIBRD onlyIcelandIDA & IBRD totalIDA blendIDA onlyIDA totalIndiaIndonesiaIran, Islamic Rep.IraqIrelandIsraelItalyJamaicaJapanJordanKazakhstanKenyaKiribatiKorea, Rep.KosovoKuwaitKyrgyz RepublicLao PDRLate-demographic dividendLatin America & Caribbean Latin America & Caribbean (excluding high income)Latin America & the Caribbean (IDA & IBRD countries)LatviaLeast developed countries: UN classificationLebanonLesothoLiberiaLibyaLiechtensteinLithuaniaLow & middle incomeLow incomeLower middle incomeLuxembourgMacao SAR, ChinaMacedonia, FYRMadagascarMalawiMalaysiaMaldivesMaliMaltaMarshall IslandsMauritaniaMauritiusMexicoMicronesia, Fed. Sts.Middle East & North AfricaMiddle East & North Africa (excluding high income)Middle East & North Africa (IDA & IBRD countries)Middle incomeMoldovaMonacoMongoliaMontenegroMoroccoMozambiqueMyanmarNamibiaNepalNetherlandsNew ZealandNicaraguaNigerNigeriaNorth AmericaNorwayOECD membersOmanOther small statesPacific island small statesPakistanPalauPanamaPapua New GuineaParaguayPeruPhilippinesPolandPortugalPost-demographic dividendPre-demographic dividendPuerto RicoQatarRomaniaRussian FederationRwandaSamoaSan MarinoSao Tome and PrincipeSaudi ArabiaSenegalSerbiaSeychellesSierra LeoneSingaporeSlovak RepublicSloveniaSmall statesSolomon IslandsSouth AfricaSouth AsiaSouth Asia (IDA & IBRD)SpainSri LankaSt. Kitts and NevisSt. LuciaSt. Vincent and the GrenadinesSub-Saharan Africa Sub-Saharan Africa (excluding high income)Sub-Saharan Africa (IDA & IBRD countries)SudanSurinameSwazilandSwedenSwitzerlandSyrian Arab RepublicTajikistanTanzaniaThailandTimor-LesteTogoTongaTrinidad and TobagoTunisiaTurkeyTurkmenistanTuvaluUgandaUkraineUnited Arab EmiratesUnited KingdomUnited StatesUpper middle incomeUruguayUzbekistanVanuatuVenezuela, RBVietnamWest Bank and GazaWorldYemen, Rep.ZambiaZimbabwe Linea del tempo:
Questa scala temporale mostra un grafico dal 1971 anno al 2015 anno. Gambia, The. I dati fino ad 1970 anno non disponibili. Il numero di osservazioni attuali secondo i date: 45.
La fonte (nome):
Indicatori dello sviluppo mondiale
La fonte (organizzazione):
World Bank staff estimates using data from the United Nations Statistics Division's National Accounts Statistics.
Categorie:
Economy & Growth, Environment
sono stati aggiornati
23 apr 2017 anni
Indicatori delle variazioni dei valori per anni
Minima:
7.067
1 gen 1977 anni
Massimo:
16.334
1 gen 2008 anni
Alla data di osservazione
Valore
Variazione assoluta
La variazione rispetto al valore precedente
1 gen 1971 anni
8.636
+8.636
0.0%
1 gen 1972 anni
9.052
+0.416
4.82%
1 gen 1973 anni
9.679
+0.627
6.93%
1 gen 1974 anni
9.235
-0.444
-4.59%
1 gen 1975 anni
8.875
-0.36
-3.9%
1 gen 1976 anni
8.077
-0.798
-8.99%
1 gen 1977 anni
7.067
-1.01
-12.5%
1 gen 1978 anni
8.361
+1.294
18.31%
1 gen 1979 anni
8.981
+0.62
7.42%
1 gen 1980 anni
10.605
+1.624
18.08%
1 gen 1981 anni
12.503
+1.898
17.9%
1 gen 1982 anni
12.558
+0.055
0.44%
1 gen 1983 anni
10.327
-2.23
-17.76%
1 gen 1984 anni
13.04
+2.713
26.27%
1 gen 1985 anni
11.531
-1.509
-11.58%
1 gen 1986 anni
10.476
-1.055
-9.15%
1 gen 1987 anni
9.582
-0.894
-8.53%
1 gen 1988 anni
10.398
+0.816
8.52%
1 gen 1989 anni
11.015
+0.617
5.94%
1 gen 1990 anni
11.784
+0.769
6.98%
1 gen 1991 anni
12.333
+0.549
4.66%
1 gen 1992 anni
12.058
-0.275
-2.23%
1 gen 1993 anni
12.649
+0.591
4.9%
1 gen 1994 anni
13.193
+0.544
4.3%
1 gen 1995 anni
13.609
+0.416
3.15%
1 gen 1996 anni
13.683
+0.074
0.54%
1 gen 1997 anni
13.711
+0.028
0.2%
1 gen 1998 anni
14.339
+0.628
4.58%
1 gen 1999 anni
14.195
-0.144
-1.0%
1 gen 2000 anni
14.034
-0.162
-1.14%
1 gen 2001 anni
13.903
-0.13
-0.93%
1 gen 2002 anni
13.611
-0.292
-2.1%
1 gen 2003 anni
14.484
+0.872
6.41%
1 gen 2004 anni
13.853
-0.631
-4.35%
1 gen 2005 anni
15.062
+1.209
8.73%
1 gen 2006 anni
15.826
+0.764
5.07%
1 gen 2007 anni
16.23
+0.404
2.55%
1 gen 2008 anni
16.334
+0.104
0.64%
1 gen 2009 anni
16.014
-0.32
-1.96%
1 gen 2010 anni
15.374
-0.64
-4.0%
1 gen 2011 anni
15.115
-0.259
-1.69%
1 gen 2012 anni
15.165
+0.05
0.33%
1 gen 2013 anni
15.026
-0.138
-0.91%
1 gen 2014 anni
14.908
-0.118
-0.79%
1 gen 2015 anni
14.861
-0.047
-0.32%
Classificazione dei paesi secondo i statistiche attuali per anni


Commenti: