29
/it/
it
AIzaSyAYiBZKx7MnpbEhh9jyipgxe19OcubqV5w
April 1, 2024
261822
Thailand
THA
true
2
1
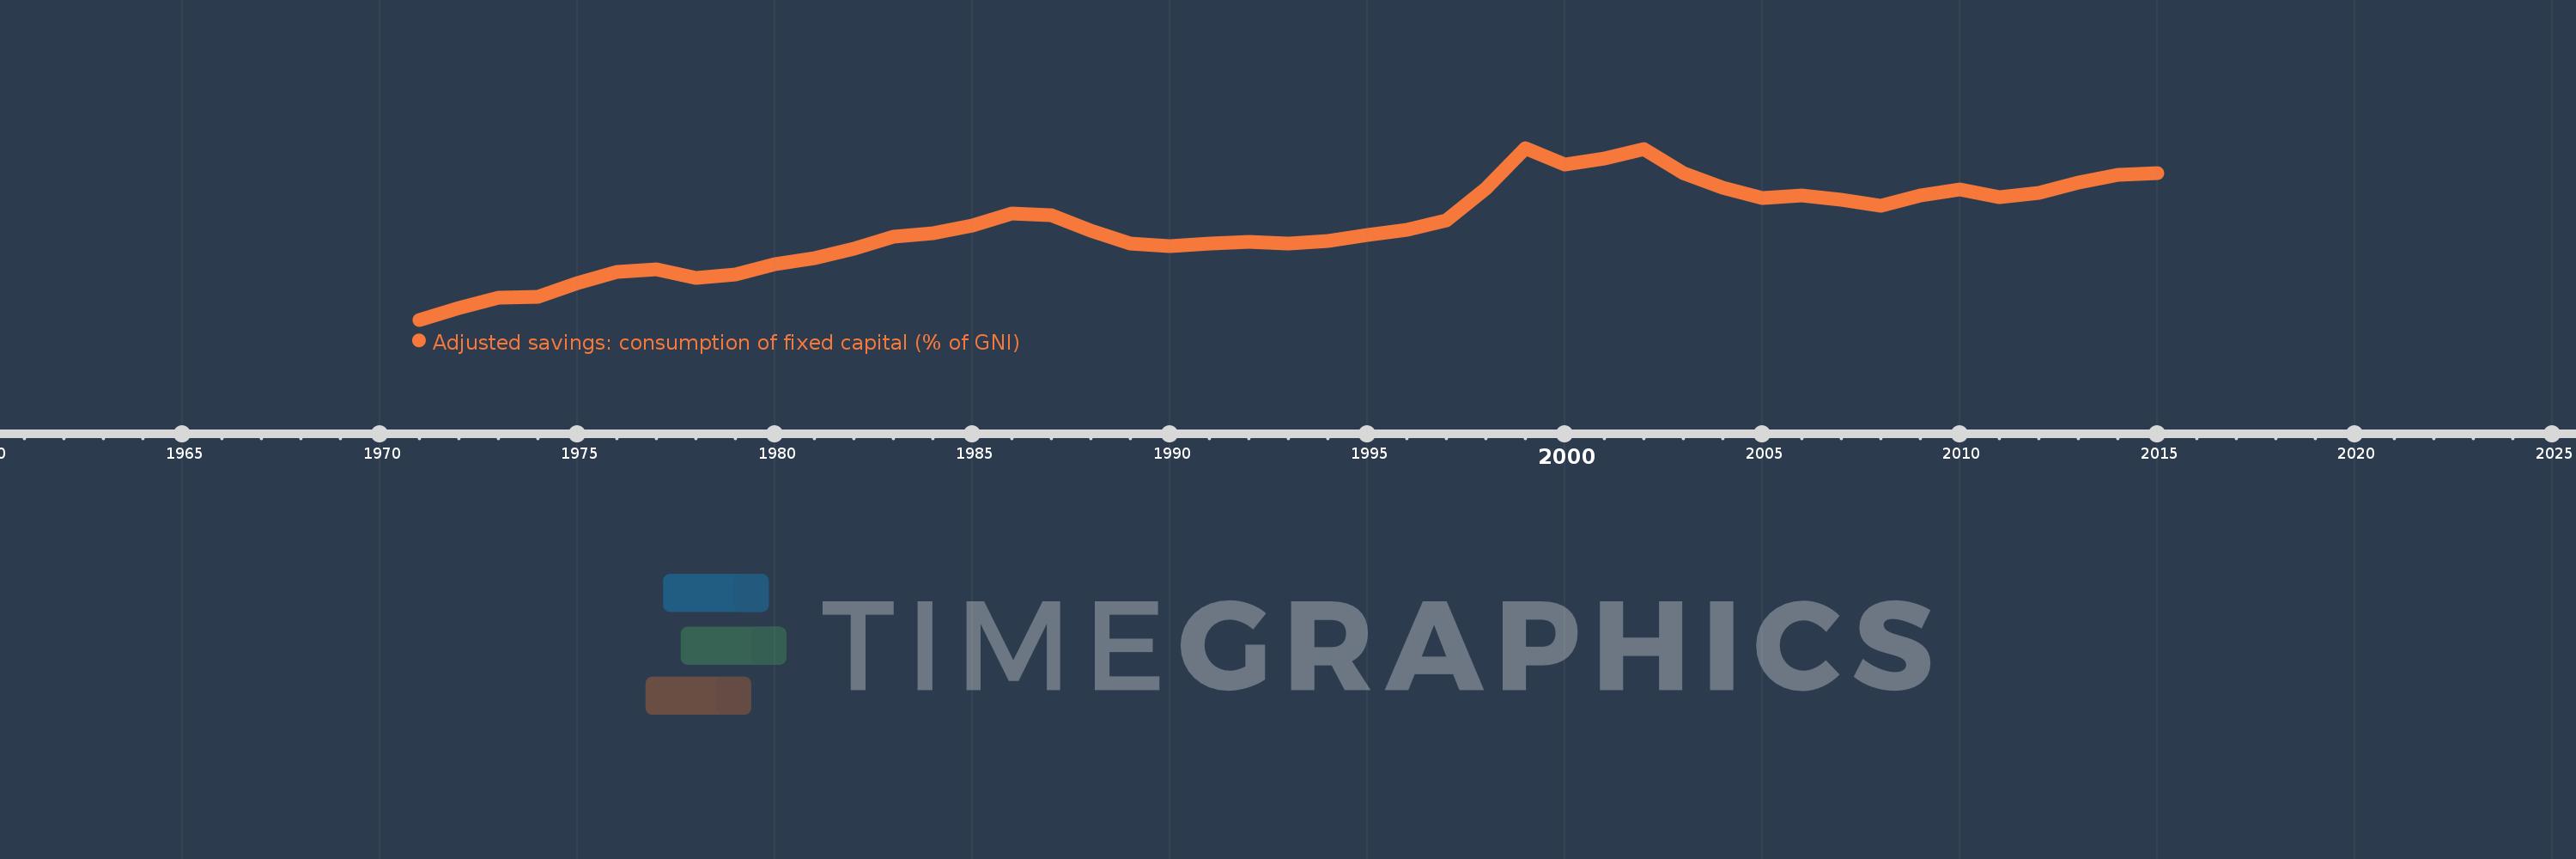
Adjusted savings: consumption of fixed capital (% of GNI)
2015,2014,2013,2012,2011,2010,2009,2008,2007,2006,2005,2004,2003,2002,2001,2000,1999,1998,1997,1996,1995,1994,1993,1992,1991,1990,1989,1988,1987,1986,1985,1984,1983,1982,1981,1980,1979,1978,1977,1976,1975,1974,1973,1972,1971
Queste statistiche in altri paesi:
AfghanistanAlbaniaAlgeriaAndorraAngolaAntigua and BarbudaArab WorldArgentinaArmeniaAustraliaAustriaAzerbaijanBahamas, TheBahrainBangladeshBarbadosBelarusBelgiumBelizeBeninBermudaBhutanBoliviaBosnia and HerzegovinaBotswanaBrazilBrunei DarussalamBulgariaBurkina FasoBurundiCabo VerdeCambodiaCameroonCanadaCaribbean small statesCentral African RepublicCentral Europe and the BalticsChadChileChinaColombiaComorosCongo, Dem. Rep.Congo, Rep.Costa RicaCote d'IvoireCroatiaCubaCyprusCzech RepublicDenmarkDjiboutiDominicaDominican RepublicEarly-demographic dividendEast Asia & PacificEast Asia & Pacific (excluding high income)East Asia & Pacific (IDA & IBRD countries)EcuadorEgypt, Arab Rep.El SalvadorEquatorial GuineaEritreaEstoniaEthiopiaEuro areaEurope & Central AsiaEurope & Central Asia (excluding high income)Europe & Central Asia (IDA & IBRD countries)European UnionFijiFinlandFragile and conflict affected situationsFranceGabonGambia, TheGeorgiaGermanyGhanaGreeceGreenlandGrenadaGuatemalaGuineaGuinea-BissauGuyanaHaitiHeavily indebted poor countries (HIPC)High incomeHondurasHong Kong SAR, ChinaHungaryIBRD onlyIcelandIDA & IBRD totalIDA blendIDA onlyIDA totalIndiaIndonesiaIran, Islamic Rep.IraqIrelandIsraelItalyJamaicaJapanJordanKazakhstanKenyaKiribatiKorea, Rep.KosovoKuwaitKyrgyz RepublicLao PDRLate-demographic dividendLatin America & Caribbean Latin America & Caribbean (excluding high income)Latin America & the Caribbean (IDA & IBRD countries)LatviaLeast developed countries: UN classificationLebanonLesothoLiberiaLibyaLiechtensteinLithuaniaLow & middle incomeLow incomeLower middle incomeLuxembourgMacao SAR, ChinaMacedonia, FYRMadagascarMalawiMalaysiaMaldivesMaliMaltaMarshall IslandsMauritaniaMauritiusMexicoMicronesia, Fed. Sts.Middle East & North AfricaMiddle East & North Africa (excluding high income)Middle East & North Africa (IDA & IBRD countries)Middle incomeMoldovaMonacoMongoliaMontenegroMoroccoMozambiqueMyanmarNamibiaNepalNetherlandsNew ZealandNicaraguaNigerNigeriaNorth AmericaNorwayOECD membersOmanOther small statesPacific island small statesPakistanPalauPanamaPapua New GuineaParaguayPeruPhilippinesPolandPortugalPost-demographic dividendPre-demographic dividendPuerto RicoQatarRomaniaRussian FederationRwandaSamoaSan MarinoSao Tome and PrincipeSaudi ArabiaSenegalSerbiaSeychellesSierra LeoneSingaporeSlovak RepublicSloveniaSmall statesSolomon IslandsSouth AfricaSouth AsiaSouth Asia (IDA & IBRD)SpainSri LankaSt. Kitts and NevisSt. LuciaSt. Vincent and the GrenadinesSub-Saharan Africa Sub-Saharan Africa (excluding high income)Sub-Saharan Africa (IDA & IBRD countries)SudanSurinameSwazilandSwedenSwitzerlandSyrian Arab RepublicTajikistanTanzaniaThailandTimor-LesteTogoTongaTrinidad and TobagoTunisiaTurkeyTurkmenistanTuvaluUgandaUkraineUnited Arab EmiratesUnited KingdomUnited StatesUpper middle incomeUruguayUzbekistanVanuatuVenezuela, RBVietnamWest Bank and GazaWorldYemen, Rep.ZambiaZimbabwe Linea del tempo:
Questa scala temporale mostra un grafico dal 1971 anno al 2015 anno. Thailand. I dati fino ad 1970 anno non disponibili. Il numero di osservazioni attuali secondo i date: 45.
La fonte (nome):
Indicatori dello sviluppo mondiale
La fonte (organizzazione):
World Bank staff estimates using data from the United Nations Statistics Division's National Accounts Statistics.
Categorie:
Economy & Growth, Environment
sono stati aggiornati
23 apr 2017 anni
Indicatori delle variazioni dei valori per anni
Minima:
5.955
1 gen 1971 anni
Massimo:
19.166
1 gen 1999 anni
Alla data di osservazione
Valore
Variazione assoluta
La variazione rispetto al valore precedente
1 gen 1971 anni
5.955
+5.955
0.0%
1 gen 1972 anni
6.868
+0.912
15.32%
1 gen 1973 anni
7.655
+0.787
11.46%
1 gen 1974 anni
7.731
+0.077
1.0%
1 gen 1975 anni
8.751
+1.019
13.19%
1 gen 1976 anni
9.659
+0.908
10.38%
1 gen 1977 anni
9.836
+0.177
1.83%
1 gen 1978 anni
9.168
-0.668
-6.79%
1 gen 1979 anni
9.46
+0.292
3.18%
1 gen 1980 anni
10.206
+0.746
7.89%
1 gen 1981 anni
10.718
+0.512
5.02%
1 gen 1982 anni
11.386
+0.668
6.24%
1 gen 1983 anni
12.341
+0.955
8.38%
1 gen 1984 anni
12.603
+0.262
2.12%
1 gen 1985 anni
13.222
+0.619
4.91%
1 gen 1986 anni
14.118
+0.896
6.77%
1 gen 1987 anni
14.017
-0.101
-0.72%
1 gen 1988 anni
12.811
-1.206
-8.6%
1 gen 1989 anni
11.831
-0.98
-7.65%
1 gen 1990 anni
11.59
-0.241
-2.04%
1 gen 1991 anni
11.785
+0.195
1.69%
1 gen 1992 anni
11.92
+0.134
1.14%
1 gen 1993 anni
11.798
-0.121
-1.02%
1 gen 1994 anni
12.043
+0.245
2.07%
1 gen 1995 anni
12.45
+0.407
3.38%
1 gen 1996 anni
12.886
+0.436
3.5%
1 gen 1997 anni
13.626
+0.74
5.75%
1 gen 1998 anni
16.053
+2.427
17.81%
1 gen 1999 anni
19.166
+3.113
19.39%
1 gen 2000 anni
17.87
-1.296
-6.76%
1 gen 2001 anni
18.346
+0.476
2.66%
1 gen 2002 anni
19.051
+0.705
3.84%
1 gen 2003 anni
17.226
-1.824
-9.58%
1 gen 2004 anni
16.118
-1.109
-6.44%
1 gen 2005 anni
15.343
-0.775
-4.81%
1 gen 2006 anni
15.546
+0.203
1.32%
1 gen 2007 anni
15.208
-0.338
-2.17%
1 gen 2008 anni
14.702
-0.506
-3.33%
1 gen 2009 anni
15.537
+0.835
5.68%
1 gen 2010 anni
15.989
+0.452
2.91%
1 gen 2011 anni
15.401
-0.588
-3.68%
1 gen 2012 anni
15.744
+0.343
2.22%
1 gen 2013 anni
16.481
+0.737
4.68%
1 gen 2014 anni
17.076
+0.594
3.61%
1 gen 2015 anni
17.243
+0.168
0.98%
Classificazione dei paesi secondo i statistiche attuali per anni


Commenti: