29
/it/
it
AIzaSyAYiBZKx7MnpbEhh9jyipgxe19OcubqV5w
April 1, 2024
124405
Egypt, Arab Rep.
EGY
true
2
1
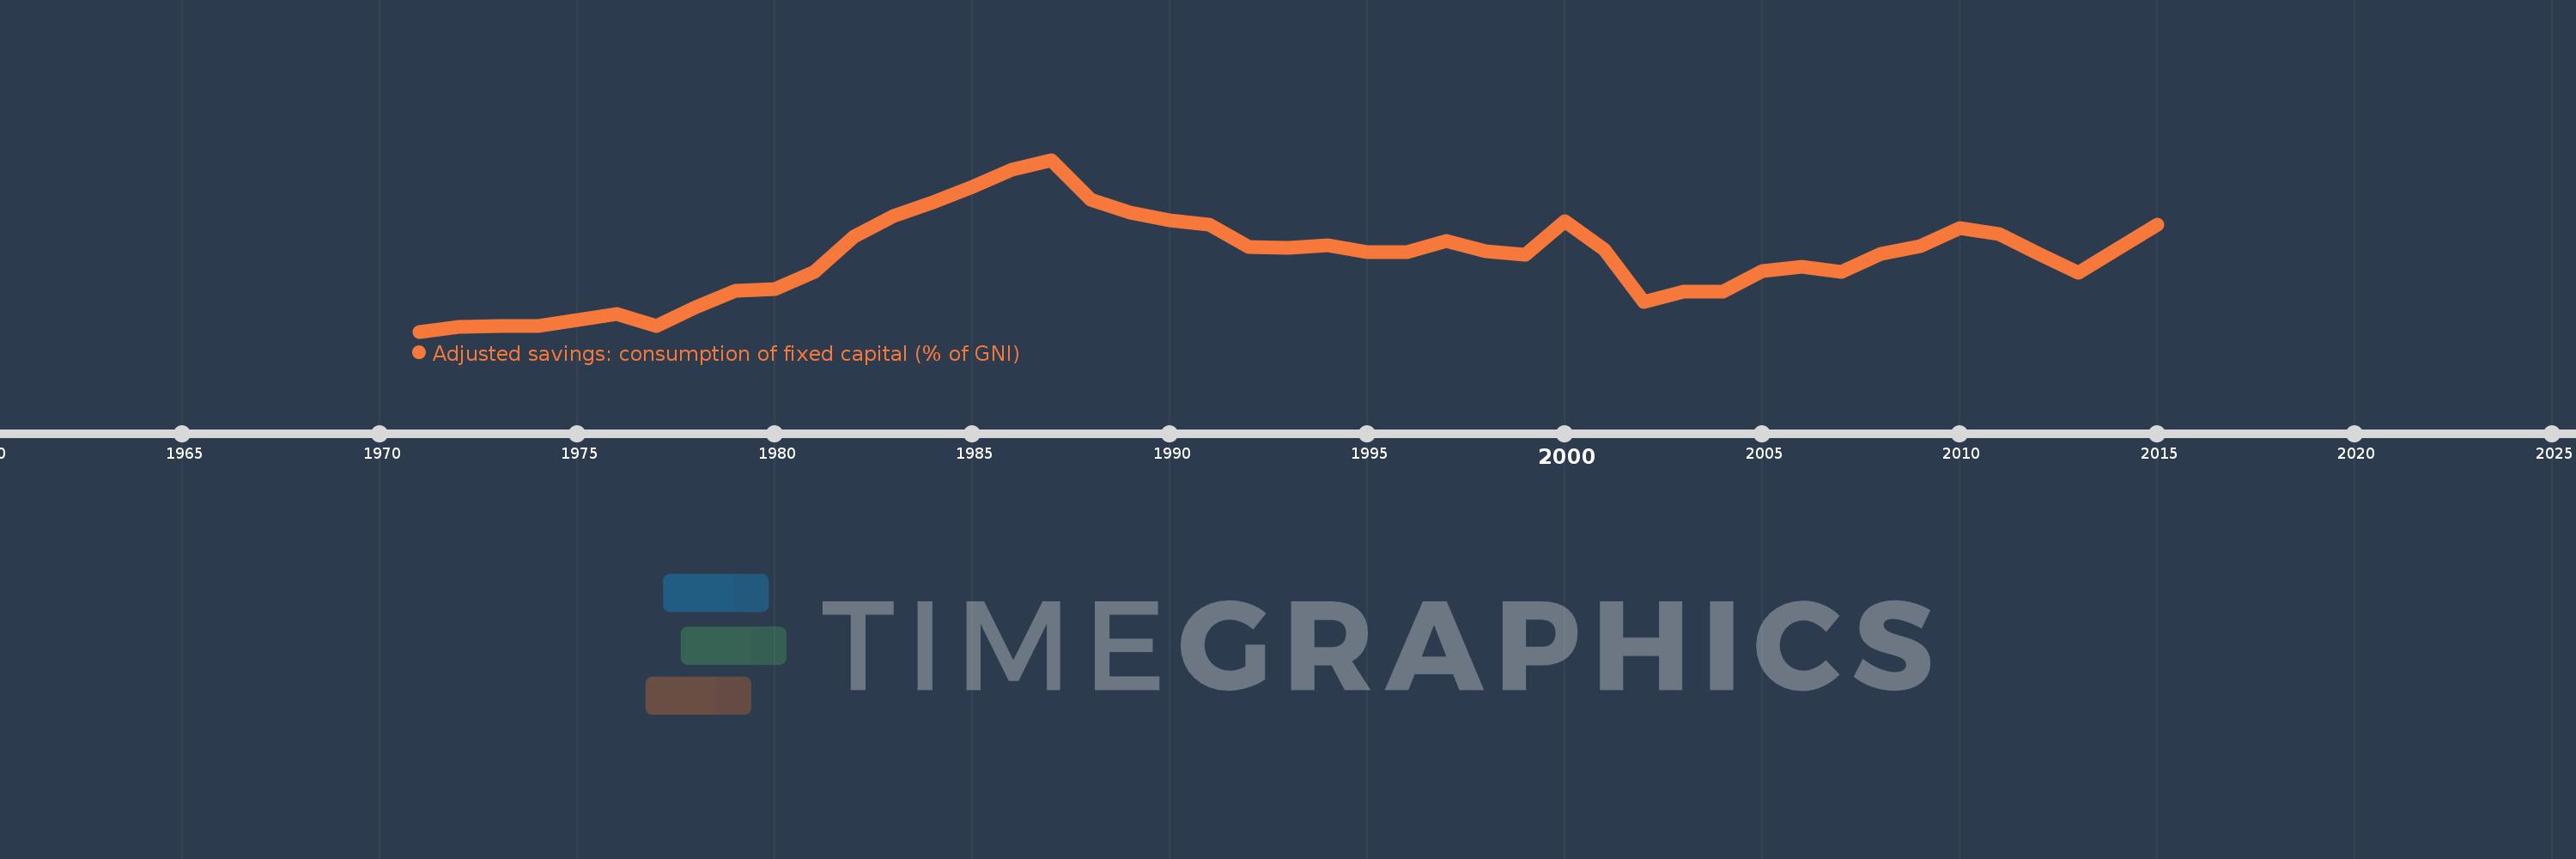
Adjusted savings: consumption of fixed capital (% of GNI)
2015,2014,2013,2012,2011,2010,2009,2008,2007,2006,2005,2004,2003,2002,2001,2000,1999,1998,1997,1996,1995,1994,1993,1992,1991,1990,1989,1988,1987,1986,1985,1984,1983,1982,1981,1980,1979,1978,1977,1976,1975,1974,1973,1972,1971
Queste statistiche in altri paesi:
AfghanistanAlbaniaAlgeriaAndorraAngolaAntigua and BarbudaArab WorldArgentinaArmeniaAustraliaAustriaAzerbaijanBahamas, TheBahrainBangladeshBarbadosBelarusBelgiumBelizeBeninBermudaBhutanBoliviaBosnia and HerzegovinaBotswanaBrazilBrunei DarussalamBulgariaBurkina FasoBurundiCabo VerdeCambodiaCameroonCanadaCaribbean small statesCentral African RepublicCentral Europe and the BalticsChadChileChinaColombiaComorosCongo, Dem. Rep.Congo, Rep.Costa RicaCote d'IvoireCroatiaCubaCyprusCzech RepublicDenmarkDjiboutiDominicaDominican RepublicEarly-demographic dividendEast Asia & PacificEast Asia & Pacific (excluding high income)East Asia & Pacific (IDA & IBRD countries)EcuadorEgypt, Arab Rep.El SalvadorEquatorial GuineaEritreaEstoniaEthiopiaEuro areaEurope & Central AsiaEurope & Central Asia (excluding high income)Europe & Central Asia (IDA & IBRD countries)European UnionFijiFinlandFragile and conflict affected situationsFranceGabonGambia, TheGeorgiaGermanyGhanaGreeceGreenlandGrenadaGuatemalaGuineaGuinea-BissauGuyanaHaitiHeavily indebted poor countries (HIPC)High incomeHondurasHong Kong SAR, ChinaHungaryIBRD onlyIcelandIDA & IBRD totalIDA blendIDA onlyIDA totalIndiaIndonesiaIran, Islamic Rep.IraqIrelandIsraelItalyJamaicaJapanJordanKazakhstanKenyaKiribatiKorea, Rep.KosovoKuwaitKyrgyz RepublicLao PDRLate-demographic dividendLatin America & Caribbean Latin America & Caribbean (excluding high income)Latin America & the Caribbean (IDA & IBRD countries)LatviaLeast developed countries: UN classificationLebanonLesothoLiberiaLibyaLiechtensteinLithuaniaLow & middle incomeLow incomeLower middle incomeLuxembourgMacao SAR, ChinaMacedonia, FYRMadagascarMalawiMalaysiaMaldivesMaliMaltaMarshall IslandsMauritaniaMauritiusMexicoMicronesia, Fed. Sts.Middle East & North AfricaMiddle East & North Africa (excluding high income)Middle East & North Africa (IDA & IBRD countries)Middle incomeMoldovaMonacoMongoliaMontenegroMoroccoMozambiqueMyanmarNamibiaNepalNetherlandsNew ZealandNicaraguaNigerNigeriaNorth AmericaNorwayOECD membersOmanOther small statesPacific island small statesPakistanPalauPanamaPapua New GuineaParaguayPeruPhilippinesPolandPortugalPost-demographic dividendPre-demographic dividendPuerto RicoQatarRomaniaRussian FederationRwandaSamoaSan MarinoSao Tome and PrincipeSaudi ArabiaSenegalSerbiaSeychellesSierra LeoneSingaporeSlovak RepublicSloveniaSmall statesSolomon IslandsSouth AfricaSouth AsiaSouth Asia (IDA & IBRD)SpainSri LankaSt. Kitts and NevisSt. LuciaSt. Vincent and the GrenadinesSub-Saharan Africa Sub-Saharan Africa (excluding high income)Sub-Saharan Africa (IDA & IBRD countries)SudanSurinameSwazilandSwedenSwitzerlandSyrian Arab RepublicTajikistanTanzaniaThailandTimor-LesteTogoTongaTrinidad and TobagoTunisiaTurkeyTurkmenistanTuvaluUgandaUkraineUnited Arab EmiratesUnited KingdomUnited StatesUpper middle incomeUruguayUzbekistanVanuatuVenezuela, RBVietnamWest Bank and GazaWorldYemen, Rep.ZambiaZimbabwe Linea del tempo:
Questa scala temporale mostra un grafico dal 1971 anno al 2015 anno. Egypt, Arab Rep.. I dati fino ad 1970 anno non disponibili. Il numero di osservazioni attuali secondo i date: 45.
La fonte (nome):
Indicatori dello sviluppo mondiale
La fonte (organizzazione):
World Bank staff estimates using data from the United Nations Statistics Division's National Accounts Statistics.
Categorie:
Economy & Growth, Environment
sono stati aggiornati
23 apr 2017 anni
Indicatori delle variazioni dei valori per anni
Minima:
4.28
1 gen 1971 anni
Massimo:
8.211
1 gen 1987 anni
Alla data di osservazione
Valore
Variazione assoluta
La variazione rispetto al valore precedente
1 gen 1971 anni
4.28
+4.28
0.0%
1 gen 1972 anni
4.385
+0.105
2.46%
1 gen 1973 anni
4.409
+0.023
0.53%
1 gen 1974 anni
4.415
+0.007
0.15%
1 gen 1975 anni
4.539
+0.124
2.81%
1 gen 1976 anni
4.676
+0.136
3.0%
1 gen 1977 anni
4.412
-0.264
-5.65%
1 gen 1978 anni
4.836
+0.424
9.62%
1 gen 1979 anni
5.208
+0.372
7.7%
1 gen 1980 anni
5.26
+0.051
0.98%
1 gen 1981 anni
5.641
+0.381
7.25%
1 gen 1982 anni
6.451
+0.81
14.36%
1 gen 1983 anni
6.923
+0.472
7.31%
1 gen 1984 anni
7.236
+0.314
4.53%
1 gen 1985 anni
7.589
+0.353
4.87%
1 gen 1986 anni
7.976
+0.387
5.1%
1 gen 1987 anni
8.211
+0.235
2.94%
1 gen 1988 anni
7.294
-0.917
-11.17%
1 gen 1989 anni
7.012
-0.282
-3.86%
1 gen 1990 anni
6.829
-0.183
-2.61%
1 gen 1991 anni
6.723
-0.106
-1.56%
1 gen 1992 anni
6.21
-0.513
-7.63%
1 gen 1993 anni
6.205
-0.005
-0.08%
1 gen 1994 anni
6.263
+0.057
0.92%
1 gen 1995 anni
6.092
-0.171
-2.73%
1 gen 1996 anni
6.104
+0.013
0.21%
1 gen 1997 anni
6.361
+0.257
4.2%
1 gen 1998 anni
6.112
-0.248
-3.91%
1 gen 1999 anni
6.042
-0.07
-1.15%
1 gen 2000 anni
6.799
+0.756
12.52%
1 gen 2001 anni
6.148
-0.651
-9.58%
1 gen 2002 anni
4.953
-1.194
-19.43%
1 gen 2003 anni
5.202
+0.249
5.02%
1 gen 2004 anni
5.188
-0.014
-0.27%
1 gen 2005 anni
5.668
+0.48
9.26%
1 gen 2006 anni
5.771
+0.103
1.81%
1 gen 2007 anni
5.655
-0.116
-2.01%
1 gen 2008 anni
6.06
+0.405
7.17%
1 gen 2009 anni
6.235
+0.175
2.88%
1 gen 2010 anni
6.639
+0.404
6.48%
1 gen 2011 anni
6.505
-0.134
-2.02%
1 gen 2012 anni
6.064
-0.441
-6.78%
1 gen 2013 anni
5.62
-0.444
-7.33%
1 gen 2014 anni
6.186
+0.566
10.07%
1 gen 2015 anni
6.725
+0.54
8.73%
Classificazione dei paesi secondo i statistiche attuali per anni


Commenti: