29
/it/
it
AIzaSyAYiBZKx7MnpbEhh9jyipgxe19OcubqV5w
April 1, 2024
85568
Bhutan
BTN
true
2
1
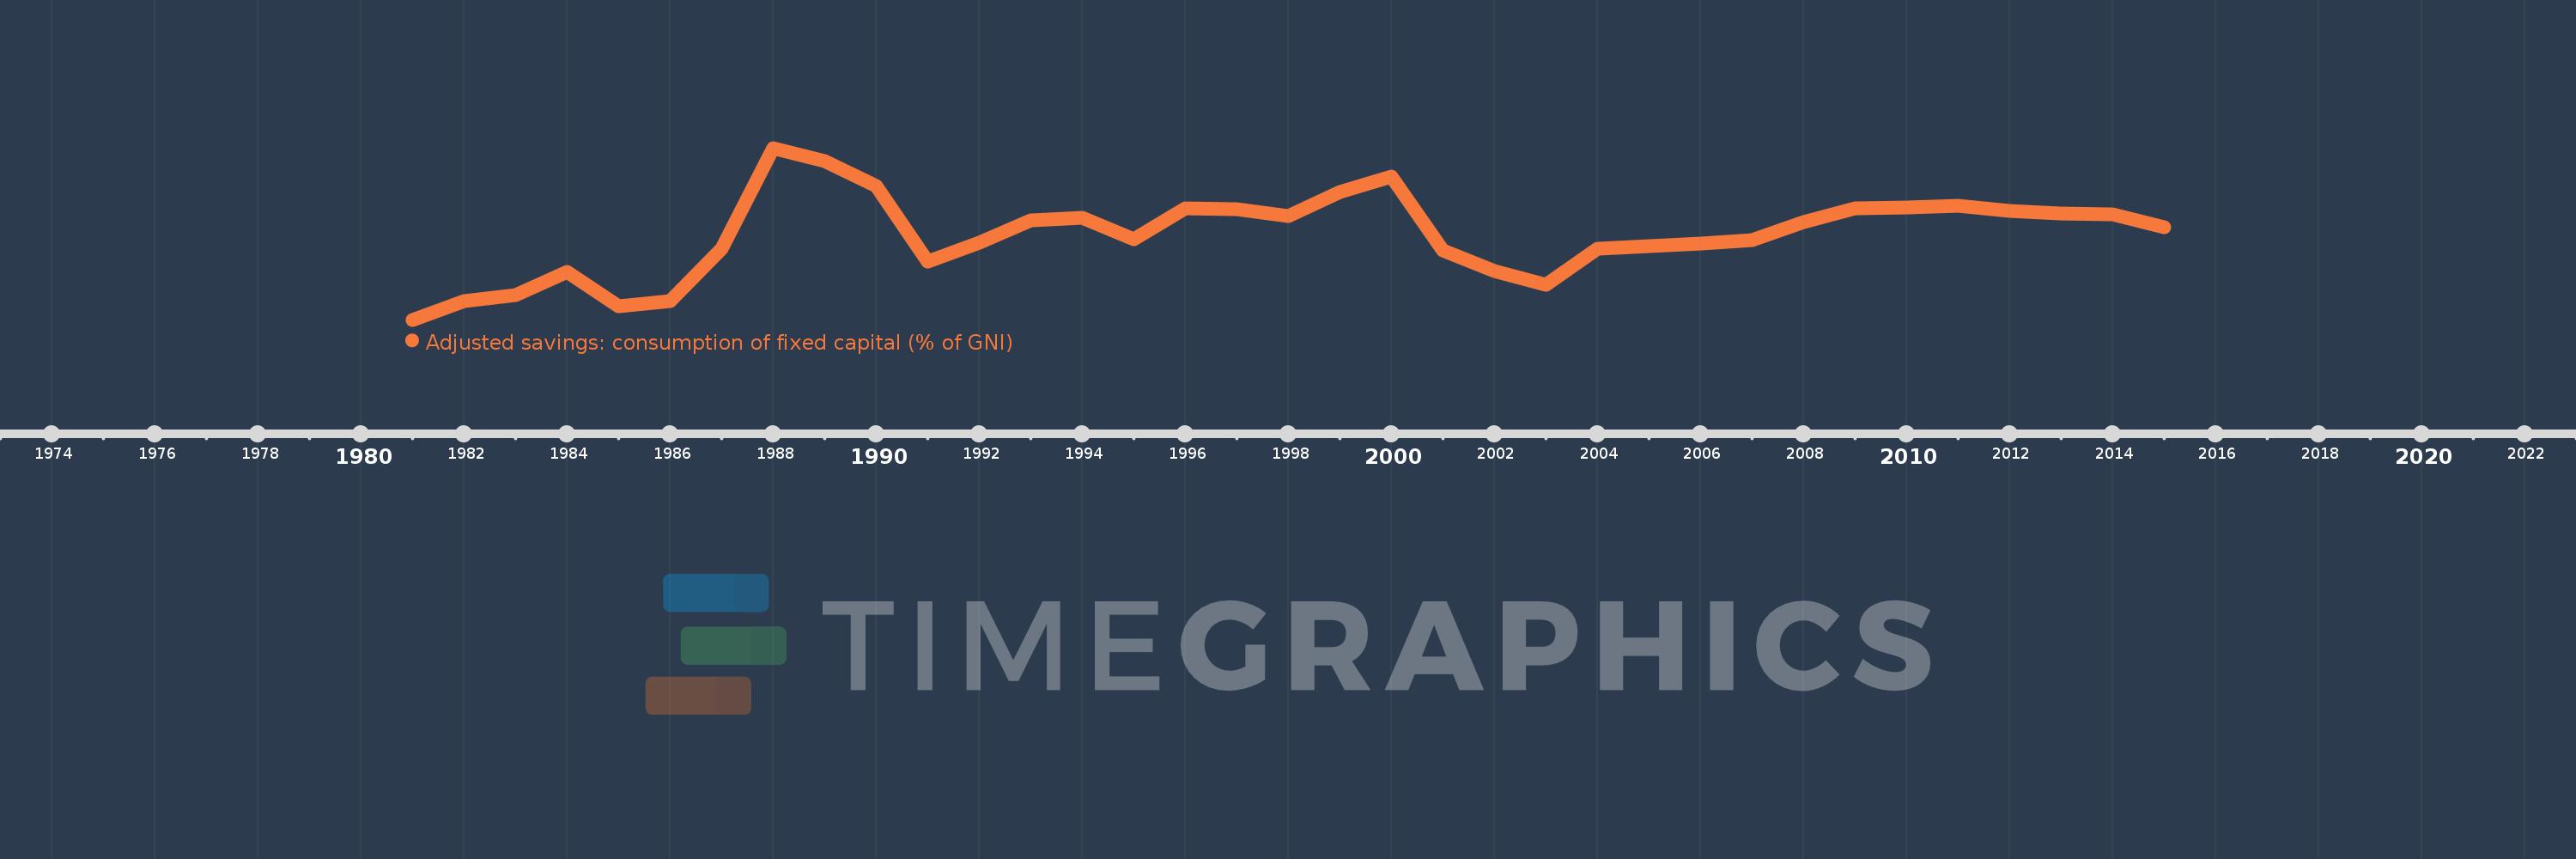
Adjusted savings: consumption of fixed capital (% of GNI)
2015,2014,2013,2012,2011,2010,2009,2008,2007,2006,2005,2004,2003,2002,2001,2000,1999,1998,1997,1996,1995,1994,1993,1992,1991,1990,1989,1988,1987,1986,1985,1984,1983,1982,1981
Queste statistiche in altri paesi:
AfghanistanAlbaniaAlgeriaAndorraAngolaAntigua and BarbudaArab WorldArgentinaArmeniaAustraliaAustriaAzerbaijanBahamas, TheBahrainBangladeshBarbadosBelarusBelgiumBelizeBeninBermudaBhutanBoliviaBosnia and HerzegovinaBotswanaBrazilBrunei DarussalamBulgariaBurkina FasoBurundiCabo VerdeCambodiaCameroonCanadaCaribbean small statesCentral African RepublicCentral Europe and the BalticsChadChileChinaColombiaComorosCongo, Dem. Rep.Congo, Rep.Costa RicaCote d'IvoireCroatiaCubaCyprusCzech RepublicDenmarkDjiboutiDominicaDominican RepublicEarly-demographic dividendEast Asia & PacificEast Asia & Pacific (excluding high income)East Asia & Pacific (IDA & IBRD countries)EcuadorEgypt, Arab Rep.El SalvadorEquatorial GuineaEritreaEstoniaEthiopiaEuro areaEurope & Central AsiaEurope & Central Asia (excluding high income)Europe & Central Asia (IDA & IBRD countries)European UnionFijiFinlandFragile and conflict affected situationsFranceGabonGambia, TheGeorgiaGermanyGhanaGreeceGreenlandGrenadaGuatemalaGuineaGuinea-BissauGuyanaHaitiHeavily indebted poor countries (HIPC)High incomeHondurasHong Kong SAR, ChinaHungaryIBRD onlyIcelandIDA & IBRD totalIDA blendIDA onlyIDA totalIndiaIndonesiaIran, Islamic Rep.IraqIrelandIsraelItalyJamaicaJapanJordanKazakhstanKenyaKiribatiKorea, Rep.KosovoKuwaitKyrgyz RepublicLao PDRLate-demographic dividendLatin America & Caribbean Latin America & Caribbean (excluding high income)Latin America & the Caribbean (IDA & IBRD countries)LatviaLeast developed countries: UN classificationLebanonLesothoLiberiaLibyaLiechtensteinLithuaniaLow & middle incomeLow incomeLower middle incomeLuxembourgMacao SAR, ChinaMacedonia, FYRMadagascarMalawiMalaysiaMaldivesMaliMaltaMarshall IslandsMauritaniaMauritiusMexicoMicronesia, Fed. Sts.Middle East & North AfricaMiddle East & North Africa (excluding high income)Middle East & North Africa (IDA & IBRD countries)Middle incomeMoldovaMonacoMongoliaMontenegroMoroccoMozambiqueMyanmarNamibiaNepalNetherlandsNew ZealandNicaraguaNigerNigeriaNorth AmericaNorwayOECD membersOmanOther small statesPacific island small statesPakistanPalauPanamaPapua New GuineaParaguayPeruPhilippinesPolandPortugalPost-demographic dividendPre-demographic dividendPuerto RicoQatarRomaniaRussian FederationRwandaSamoaSan MarinoSao Tome and PrincipeSaudi ArabiaSenegalSerbiaSeychellesSierra LeoneSingaporeSlovak RepublicSloveniaSmall statesSolomon IslandsSouth AfricaSouth AsiaSouth Asia (IDA & IBRD)SpainSri LankaSt. Kitts and NevisSt. LuciaSt. Vincent and the GrenadinesSub-Saharan Africa Sub-Saharan Africa (excluding high income)Sub-Saharan Africa (IDA & IBRD countries)SudanSurinameSwazilandSwedenSwitzerlandSyrian Arab RepublicTajikistanTanzaniaThailandTimor-LesteTogoTongaTrinidad and TobagoTunisiaTurkeyTurkmenistanTuvaluUgandaUkraineUnited Arab EmiratesUnited KingdomUnited StatesUpper middle incomeUruguayUzbekistanVanuatuVenezuela, RBVietnamWest Bank and GazaWorldYemen, Rep.ZambiaZimbabwe Linea del tempo:
Questa scala temporale mostra un grafico dal 1981 anno al 2015 anno. Bhutan. I dati fino ad 1980 anno non disponibili. Il numero di osservazioni attuali secondo i date: 35.
La fonte (nome):
Indicatori dello sviluppo mondiale
La fonte (organizzazione):
World Bank staff estimates using data from the United Nations Statistics Division's National Accounts Statistics.
Categorie:
Economy & Growth, Environment
sono stati aggiornati
23 apr 2017 anni
Indicatori delle variazioni dei valori per anni
Minima:
5.826
1 gen 1981 anni
Massimo:
9.585
1 gen 1988 anni
Alla data di osservazione
Valore
Variazione assoluta
La variazione rispetto al valore precedente
1 gen 1981 anni
5.826
+5.826
0.0%
1 gen 1982 anni
6.231
+0.405
6.96%
1 gen 1983 anni
6.357
+0.125
2.01%
1 gen 1984 anni
6.864
+0.507
7.98%
1 gen 1985 anni
6.114
-0.75
-10.92%
1 gen 1986 anni
6.24
+0.125
2.05%
1 gen 1987 anni
7.388
+1.149
18.41%
1 gen 1988 anni
9.585
+2.197
29.73%
1 gen 1989 anni
9.305
-0.28
-2.92%
1 gen 1990 anni
8.754
-0.55
-5.92%
1 gen 1991 anni
7.1
-1.654
-18.89%
1 gen 1992 anni
7.517
+0.417
5.87%
1 gen 1993 anni
8.007
+0.49
6.52%
1 gen 1994 anni
8.054
+0.046
0.58%
1 gen 1995 anni
7.591
-0.463
-5.75%
1 gen 1996 anni
8.269
+0.678
8.94%
1 gen 1997 anni
8.247
-0.022
-0.26%
1 gen 1998 anni
8.088
-0.159
-1.93%
1 gen 1999 anni
8.627
+0.539
6.66%
1 gen 2000 anni
8.953
+0.326
3.78%
1 gen 2001 anni
7.34
-1.613
-18.02%
1 gen 2002 anni
6.893
-0.447
-6.09%
1 gen 2003 anni
6.589
-0.305
-4.42%
1 gen 2004 anni
7.378
+0.789
11.98%
1 gen 2005 anni
7.43
+0.052
0.7%
1 gen 2006 anni
7.49
+0.06
0.81%
1 gen 2007 anni
7.574
+0.084
1.12%
1 gen 2008 anni
7.959
+0.385
5.09%
1 gen 2009 anni
8.271
+0.312
3.92%
1 gen 2010 anni
8.288
+0.017
0.2%
1 gen 2011 anni
8.321
+0.034
0.4%
1 gen 2012 anni
8.202
-0.12
-1.44%
1 gen 2013 anni
8.155
-0.047
-0.57%
1 gen 2014 anni
8.135
-0.02
-0.25%
1 gen 2015 anni
7.842
-0.293
-3.6%
Classificazione dei paesi secondo i statistiche attuali per anni


Commenti: