29
/it/
it
AIzaSyAYiBZKx7MnpbEhh9jyipgxe19OcubqV5w
April 1, 2024
89213
Bosnia and Herzegovina
BIH
true
2
1
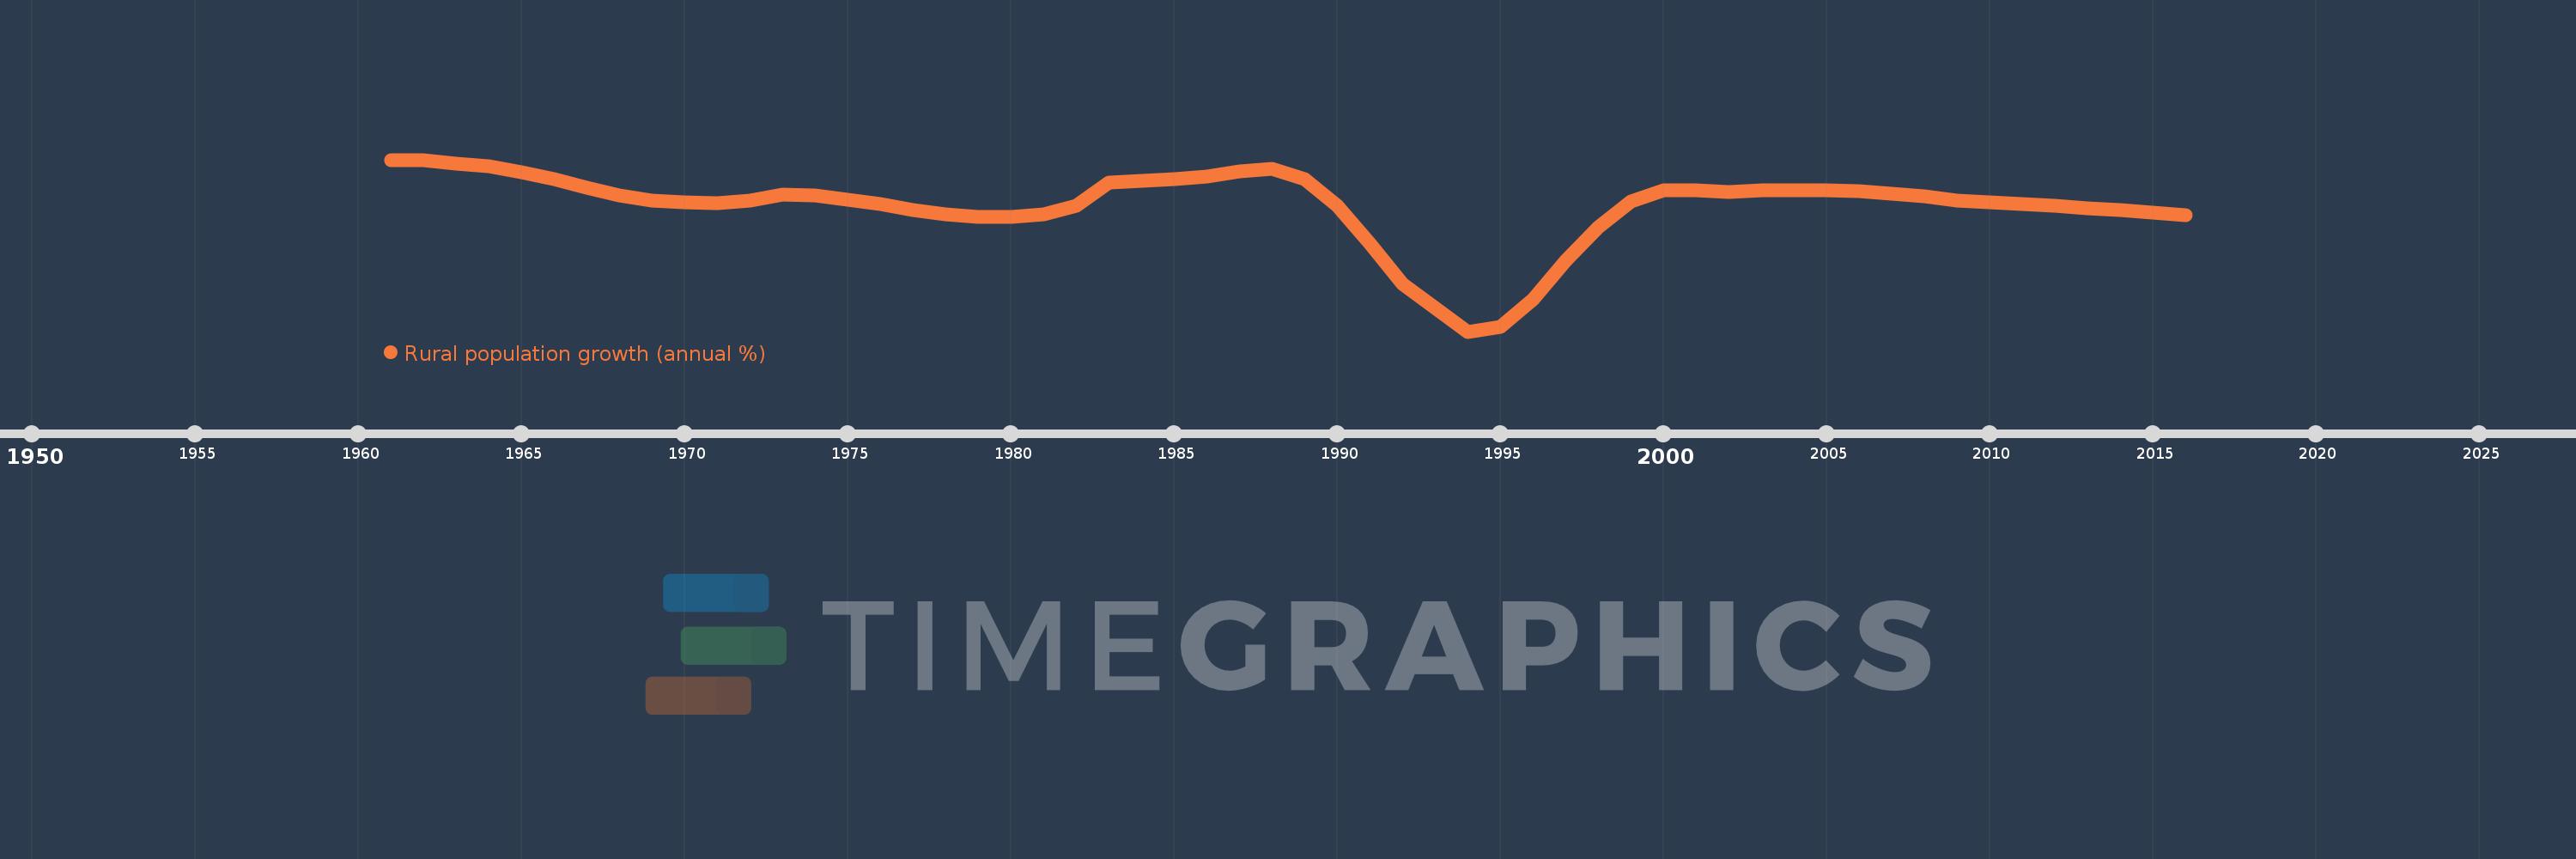
Rural population growth (annual %)
2016,2015,2014,2013,2012,2011,2010,2009,2008,2007,2006,2005,2004,2003,2002,2001,2000,1999,1998,1997,1996,1995,1994,1993,1992,1991,1990,1989,1988,1987,1986,1985,1984,1983,1982,1981,1980,1979,1978,1977,1976,1975,1974,1973,1972,1971,1970,1969,1968,1967,1966,1965,1964,1963,1962,1961
Queste statistiche in altri paesi:
AfghanistanAlbaniaAlgeriaAmerican SamoaAndorraAngolaAntigua and BarbudaArab WorldArgentinaArmeniaArubaAustraliaAustriaAzerbaijanBahamas, TheBahrainBangladeshBarbadosBelarusBelgiumBelizeBeninBhutanBoliviaBosnia and HerzegovinaBotswanaBrazilBritish Virgin IslandsBrunei DarussalamBulgariaBurkina FasoBurundiCabo VerdeCambodiaCameroonCanadaCaribbean small statesCentral African RepublicCentral Europe and the BalticsChadChannel IslandsChileChinaColombiaComorosCongo, Dem. Rep.Congo, Rep.Costa RicaCote d'IvoireCroatiaCubaCuracaoCyprusCzech RepublicDenmarkDjiboutiDominicaDominican RepublicEarly-demographic dividendEast Asia & PacificEast Asia & Pacific (excluding high income)East Asia & Pacific (IDA & IBRD countries)EcuadorEgypt, Arab Rep.El SalvadorEquatorial GuineaEritreaEstoniaEthiopiaEuro areaEurope & Central AsiaEurope & Central Asia (excluding high income)Europe & Central Asia (IDA & IBRD countries)European UnionFaroe IslandsFijiFinlandFragile and conflict affected situationsFranceFrench PolynesiaGabonGambia, TheGeorgiaGermanyGhanaGreeceGreenlandGrenadaGuamGuatemalaGuineaGuinea-BissauGuyanaHaitiHeavily indebted poor countries (HIPC)High incomeHondurasHong Kong SAR, ChinaHungaryIBRD onlyIcelandIDA & IBRD totalIDA blendIDA onlyIDA totalIndiaIndonesiaIran, Islamic Rep.IraqIrelandIsle of ManIsraelItalyJamaicaJapanJordanKazakhstanKenyaKiribatiKorea, Dem. People’s Rep.Korea, Rep.KuwaitKyrgyz RepublicLao PDRLate-demographic dividendLatin America & Caribbean Latin America & Caribbean (excluding high income)Latin America & the Caribbean (IDA & IBRD countries)LatviaLeast developed countries: UN classificationLebanonLesothoLiberiaLibyaLiechtensteinLithuaniaLow & middle incomeLow incomeLower middle incomeLuxembourgMacao SAR, ChinaMacedonia, FYRMadagascarMalawiMalaysiaMaldivesMaliMaltaMarshall IslandsMauritaniaMauritiusMexicoMicronesia, Fed. Sts.Middle East & North AfricaMiddle East & North Africa (excluding high income)Middle East & North Africa (IDA & IBRD countries)Middle incomeMoldovaMongoliaMontenegroMoroccoMozambiqueMyanmarNamibiaNauruNepalNetherlandsNew CaledoniaNew ZealandNicaraguaNigerNigeriaNorth AmericaNorthern Mariana IslandsNorwayOECD membersOmanOther small statesPacific island small statesPakistanPalauPanamaPapua New GuineaParaguayPeruPhilippinesPolandPortugalPost-demographic dividendPre-demographic dividendPuerto RicoQatarRomaniaRussian FederationRwandaSamoaSan MarinoSao Tome and PrincipeSaudi ArabiaSenegalSerbiaSeychellesSierra LeoneSlovak RepublicSloveniaSmall statesSolomon IslandsSomaliaSouth AfricaSouth AsiaSouth Asia (IDA & IBRD)South SudanSpainSri LankaSt. Kitts and NevisSt. LuciaSt. Vincent and the GrenadinesSub-Saharan Africa Sub-Saharan Africa (excluding high income)Sub-Saharan Africa (IDA & IBRD countries)SudanSurinameSwazilandSwedenSwitzerlandSyrian Arab RepublicTajikistanTanzaniaThailandTimor-LesteTogoTongaTrinidad and TobagoTunisiaTurkeyTurkmenistanTurks and Caicos IslandsTuvaluUgandaUkraineUnited Arab EmiratesUnited KingdomUnited StatesUpper middle incomeUruguayUzbekistanVanuatuVenezuela, RBVietnamVirgin Islands (U.S.)West Bank and GazaWorldYemen, Rep.ZambiaZimbabwe Linea del tempo:
Questa scala temporale mostra un grafico dal 1961 anno al 2016 anno. Bosnia and Herzegovina. I dati fino ad 1960 anno non disponibili. Il numero di osservazioni attuali secondo i date: 56.
La fonte (nome):
Indicatori dello sviluppo mondiale
La fonte (organizzazione):
World Bank Staff estimates based on United Nations, World Urbanization Prospects.
Categorie:
Agriculture & Rural Development
sono stati aggiornati
23 apr 2017 anni
Indicatori delle variazioni dei valori per anni
Minima:
-3.756
1 gen 1994 anni
Massimo:
1.129
1 gen 1961 anni
Alla data di osservazione
Valore
Variazione assoluta
La variazione rispetto al valore precedente
1 gen 1961 anni
1.129
+1.129
0.0%
1 gen 1962 anni
1.127
-0.002
-0.18%
1 gen 1963 anni
1.016
-0.111
-9.84%
1 gen 1964 anni
0.941
-0.075
-7.35%
1 gen 1965 anni
0.779
-0.163
-17.29%
1 gen 1966 anni
0.569
-0.21
-26.97%
1 gen 1967 anni
0.331
-0.237
-41.71%
1 gen 1968 anni
0.123
-0.209
-62.97%
1 gen 1969 anni
-0.026
-0.149
-121.2%
1 gen 1970 anni
-0.089
-0.063
243.8%
1 gen 1971 anni
-0.104
-0.014
16.04%
1 gen 1972 anni
-0.032
+0.072
-69.36%
1 gen 1973 anni
0.142
+0.173
-544.97%
1 gen 1974 anni
0.105
-0.037
-26.05%
1 gen 1975 anni
0.002
-0.103
-98.29%
1 gen 1976 anni
-0.136
-0.138
-7.69 Mille.%
1 gen 1977 anni
-0.293
-0.157
115.29%
1 gen 1978 anni
-0.419
-0.126
42.91%
1 gen 1979 anni
-0.492
-0.074
17.62%
1 gen 1980 anni
-0.488
+0.004
-0.87%
1 gen 1981 anni
-0.434
+0.054
-11.03%
1 gen 1982 anni
-0.184
+0.25
-57.54%
1 gen 1983 anni
0.477
+0.662
-358.98%
1 gen 1984 anni
0.519
+0.041
8.6%
1 gen 1985 anni
0.589
+0.071
13.66%
1 gen 1986 anni
0.655
+0.066
11.15%
1 gen 1987 anni
0.81
+0.154
23.58%
1 gen 1988 anni
0.884
+0.075
9.24%
1 gen 1989 anni
0.589
-0.296
-33.45%
1 gen 1990 anni
-0.179
-0.768
-130.5%
1 gen 1991 anni
-1.258
-1.079
601.14%
1 gen 1992 anni
-2.394
-1.135
90.2%
1 gen 1993 anni
-3.095
-0.701
29.29%
1 gen 1994 anni
-3.756
-0.662
21.38%
1 gen 1995 anni
-3.627
+0.129
-3.43%
1 gen 1996 anni
-2.836
+0.791
-21.82%
1 gen 1997 anni
-1.75
+1.086
-38.28%
1 gen 1998 anni
-0.79
+0.96
-54.87%
1 gen 1999 anni
-0.057
+0.733
-92.81%
1 gen 2000 anni
0.259
+0.316
-556.07%
1 gen 2001 anni
0.259
-0.001
-0.21%
1 gen 2002 anni
0.216
-0.043
-16.68%
1 gen 2003 anni
0.261
+0.045
20.95%
1 gen 2004 anni
0.268
+0.007
2.83%
1 gen 2005 anni
0.258
-0.01
-3.57%
1 gen 2006 anni
0.231
-0.028
-10.81%
1 gen 2007 anni
0.168
-0.062
-27.05%
1 gen 2008 anni
0.084
-0.084
-49.85%
1 gen 2009 anni
-0.019
-0.103
-122.58%
1 gen 2010 anni
-0.089
-0.07
365.87%
1 gen 2011 anni
-0.135
-0.046
52.34%
1 gen 2012 anni
-0.184
-0.049
36.06%
1 gen 2013 anni
-0.245
-0.061
33.21%
1 gen 2014 anni
-0.306
-0.061
24.9%
1 gen 2015 anni
-0.372
-0.066
21.42%
1 gen 2016 anni
-0.438
-0.066
17.76%
Classificazione dei paesi secondo i statistiche attuali per anni


Commenti: