29
/it/
it
AIzaSyAYiBZKx7MnpbEhh9jyipgxe19OcubqV5w
April 1, 2024
160968
Israel
ISR
true
2
1
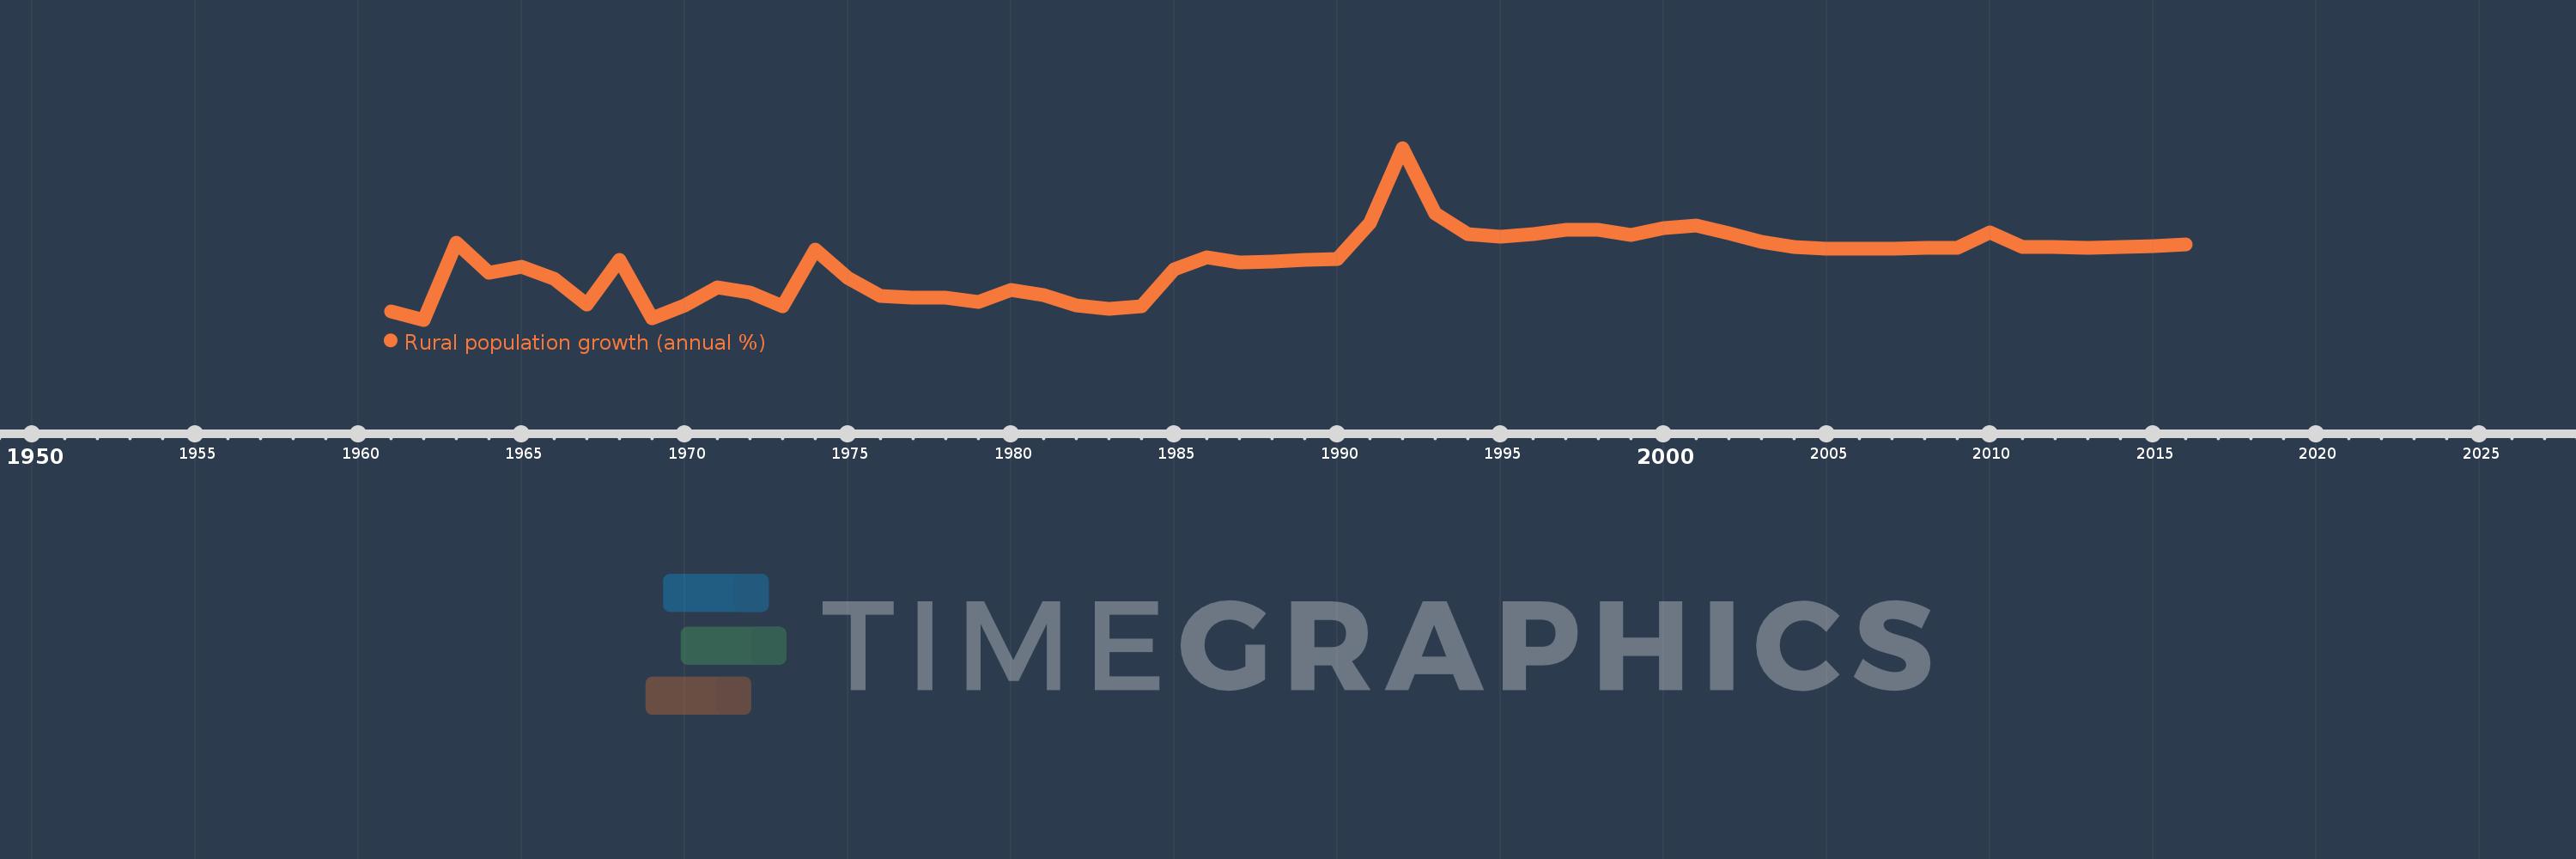
Rural population growth (annual %)
2016,2015,2014,2013,2012,2011,2010,2009,2008,2007,2006,2005,2004,2003,2002,2001,2000,1999,1998,1997,1996,1995,1994,1993,1992,1991,1990,1989,1988,1987,1986,1985,1984,1983,1982,1981,1980,1979,1978,1977,1976,1975,1974,1973,1972,1971,1970,1969,1968,1967,1966,1965,1964,1963,1962,1961
Queste statistiche in altri paesi:
AfghanistanAlbaniaAlgeriaAmerican SamoaAndorraAngolaAntigua and BarbudaArab WorldArgentinaArmeniaArubaAustraliaAustriaAzerbaijanBahamas, TheBahrainBangladeshBarbadosBelarusBelgiumBelizeBeninBhutanBoliviaBosnia and HerzegovinaBotswanaBrazilBritish Virgin IslandsBrunei DarussalamBulgariaBurkina FasoBurundiCabo VerdeCambodiaCameroonCanadaCaribbean small statesCentral African RepublicCentral Europe and the BalticsChadChannel IslandsChileChinaColombiaComorosCongo, Dem. Rep.Congo, Rep.Costa RicaCote d'IvoireCroatiaCubaCuracaoCyprusCzech RepublicDenmarkDjiboutiDominicaDominican RepublicEarly-demographic dividendEast Asia & PacificEast Asia & Pacific (excluding high income)East Asia & Pacific (IDA & IBRD countries)EcuadorEgypt, Arab Rep.El SalvadorEquatorial GuineaEritreaEstoniaEthiopiaEuro areaEurope & Central AsiaEurope & Central Asia (excluding high income)Europe & Central Asia (IDA & IBRD countries)European UnionFaroe IslandsFijiFinlandFragile and conflict affected situationsFranceFrench PolynesiaGabonGambia, TheGeorgiaGermanyGhanaGreeceGreenlandGrenadaGuamGuatemalaGuineaGuinea-BissauGuyanaHaitiHeavily indebted poor countries (HIPC)High incomeHondurasHong Kong SAR, ChinaHungaryIBRD onlyIcelandIDA & IBRD totalIDA blendIDA onlyIDA totalIndiaIndonesiaIran, Islamic Rep.IraqIrelandIsle of ManIsraelItalyJamaicaJapanJordanKazakhstanKenyaKiribatiKorea, Dem. People’s Rep.Korea, Rep.KuwaitKyrgyz RepublicLao PDRLate-demographic dividendLatin America & Caribbean Latin America & Caribbean (excluding high income)Latin America & the Caribbean (IDA & IBRD countries)LatviaLeast developed countries: UN classificationLebanonLesothoLiberiaLibyaLiechtensteinLithuaniaLow & middle incomeLow incomeLower middle incomeLuxembourgMacao SAR, ChinaMacedonia, FYRMadagascarMalawiMalaysiaMaldivesMaliMaltaMarshall IslandsMauritaniaMauritiusMexicoMicronesia, Fed. Sts.Middle East & North AfricaMiddle East & North Africa (excluding high income)Middle East & North Africa (IDA & IBRD countries)Middle incomeMoldovaMongoliaMontenegroMoroccoMozambiqueMyanmarNamibiaNauruNepalNetherlandsNew CaledoniaNew ZealandNicaraguaNigerNigeriaNorth AmericaNorthern Mariana IslandsNorwayOECD membersOmanOther small statesPacific island small statesPakistanPalauPanamaPapua New GuineaParaguayPeruPhilippinesPolandPortugalPost-demographic dividendPre-demographic dividendPuerto RicoQatarRomaniaRussian FederationRwandaSamoaSan MarinoSao Tome and PrincipeSaudi ArabiaSenegalSerbiaSeychellesSierra LeoneSlovak RepublicSloveniaSmall statesSolomon IslandsSomaliaSouth AfricaSouth AsiaSouth Asia (IDA & IBRD)South SudanSpainSri LankaSt. Kitts and NevisSt. LuciaSt. Vincent and the GrenadinesSub-Saharan Africa Sub-Saharan Africa (excluding high income)Sub-Saharan Africa (IDA & IBRD countries)SudanSurinameSwazilandSwedenSwitzerlandSyrian Arab RepublicTajikistanTanzaniaThailandTimor-LesteTogoTongaTrinidad and TobagoTunisiaTurkeyTurkmenistanTurks and Caicos IslandsTuvaluUgandaUkraineUnited Arab EmiratesUnited KingdomUnited StatesUpper middle incomeUruguayUzbekistanVanuatuVenezuela, RBVietnamVirgin Islands (U.S.)West Bank and GazaWorldYemen, Rep.ZambiaZimbabwe Linea del tempo:
Questa scala temporale mostra un grafico dal 1961 anno al 2016 anno. Israel. I dati fino ad 1960 anno non disponibili. Il numero di osservazioni attuali secondo i date: 56.
La fonte (nome):
Indicatori dello sviluppo mondiale
La fonte (organizzazione):
World Bank Staff estimates based on United Nations, World Urbanization Prospects.
Categorie:
Agriculture & Rural Development
sono stati aggiornati
23 apr 2017 anni
Indicatori delle variazioni dei valori per anni
Minima:
-1.733
1 gen 1962 anni
Massimo:
4.932
1 gen 1992 anni
Alla data di osservazione
Valore
Variazione assoluta
La variazione rispetto al valore precedente
1 gen 1961 anni
-1.417
-1.417
0.0%
1 gen 1962 anni
-1.733
-0.316
22.29%
1 gen 1963 anni
1.269
+3.002
-173.21%
1 gen 1964 anni
0.098
-1.171
-92.3%
1 gen 1965 anni
0.33
+0.232
237.72%
1 gen 1966 anni
-0.153
-0.483
-146.51%
1 gen 1967 anni
-1.145
-0.991
646.29%
1 gen 1968 anni
0.602
+1.747
-152.62%
1 gen 1969 anni
-1.662
-2.265
-375.96%
1 gen 1970 anni
-1.16
+0.503
-30.25%
1 gen 1971 anni
-0.489
+0.67
-57.81%
1 gen 1972 anni
-0.686
-0.197
40.3%
1 gen 1973 anni
-1.223
-0.537
78.21%
1 gen 1974 anni
0.983
+2.206
-180.34%
1 gen 1975 anni
-0.105
-1.088
-110.69%
1 gen 1976 anni
-0.805
-0.7
666.67%
1 gen 1977 anni
-0.885
-0.08
9.87%
1 gen 1978 anni
-0.875
+0.01
-1.08%
1 gen 1979 anni
-1.031
-0.156
17.82%
1 gen 1980 anni
-0.581
+0.451
-43.71%
1 gen 1981 anni
-0.771
-0.191
32.88%
1 gen 1982 anni
-1.185
-0.414
53.64%
1 gen 1983 anni
-1.31
-0.124
10.49%
1 gen 1984 anni
-1.223
+0.087
-6.62%
1 gen 1985 anni
0.233
+1.456
-119.05%
1 gen 1986 anni
0.698
+0.465
199.51%
1 gen 1987 anni
0.48
-0.218
-31.27%
1 gen 1988 anni
0.536
+0.057
11.85%
1 gen 1989 anni
0.587
+0.05
9.35%
1 gen 1990 anni
0.625
+0.038
6.5%
1 gen 1991 anni
2.022
+1.397
223.62%
1 gen 1992 anni
4.932
+2.911
143.96%
1 gen 1993 anni
2.38
-2.552
-51.74%
1 gen 1994 anni
1.582
-0.798
-33.54%
1 gen 1995 anni
1.501
-0.081
-5.09%
1 gen 1996 anni
1.59
+0.089
5.92%
1 gen 1997 anni
1.77
+0.18
11.31%
1 gen 1998 anni
1.767
-0.003
-0.16%
1 gen 1999 anni
1.561
-0.206
-11.66%
1 gen 2000 anni
1.816
+0.254
16.3%
1 gen 2001 anni
1.917
+0.102
5.61%
1 gen 2002 anni
1.627
-0.29
-15.15%
1 gen 2003 anni
1.29
-0.337
-20.71%
1 gen 2004 anni
1.076
-0.214
-16.58%
1 gen 2005 anni
1.033
-0.043
-4.0%
1 gen 2006 anni
1.035
+0.002
0.15%
1 gen 2007 anni
1.034
0.0
-0.03%
1 gen 2008 anni
1.049
+0.015
1.43%
1 gen 2009 anni
1.044
-0.005
-0.47%
1 gen 2010 anni
1.652
+0.608
58.27%
1 gen 2011 anni
1.083
-0.569
-34.43%
1 gen 2012 anni
1.087
+0.003
0.31%
1 gen 2013 anni
1.067
-0.02
-1.86%
1 gen 2014 anni
1.081
+0.014
1.3%
1 gen 2015 anni
1.115
+0.035
3.2%
1 gen 2016 anni
1.174
+0.059
5.27%
Classificazione dei paesi secondo i statistiche attuali per anni


Commenti: