29
/it/
it
AIzaSyAYiBZKx7MnpbEhh9jyipgxe19OcubqV5w
April 1, 2024
41051
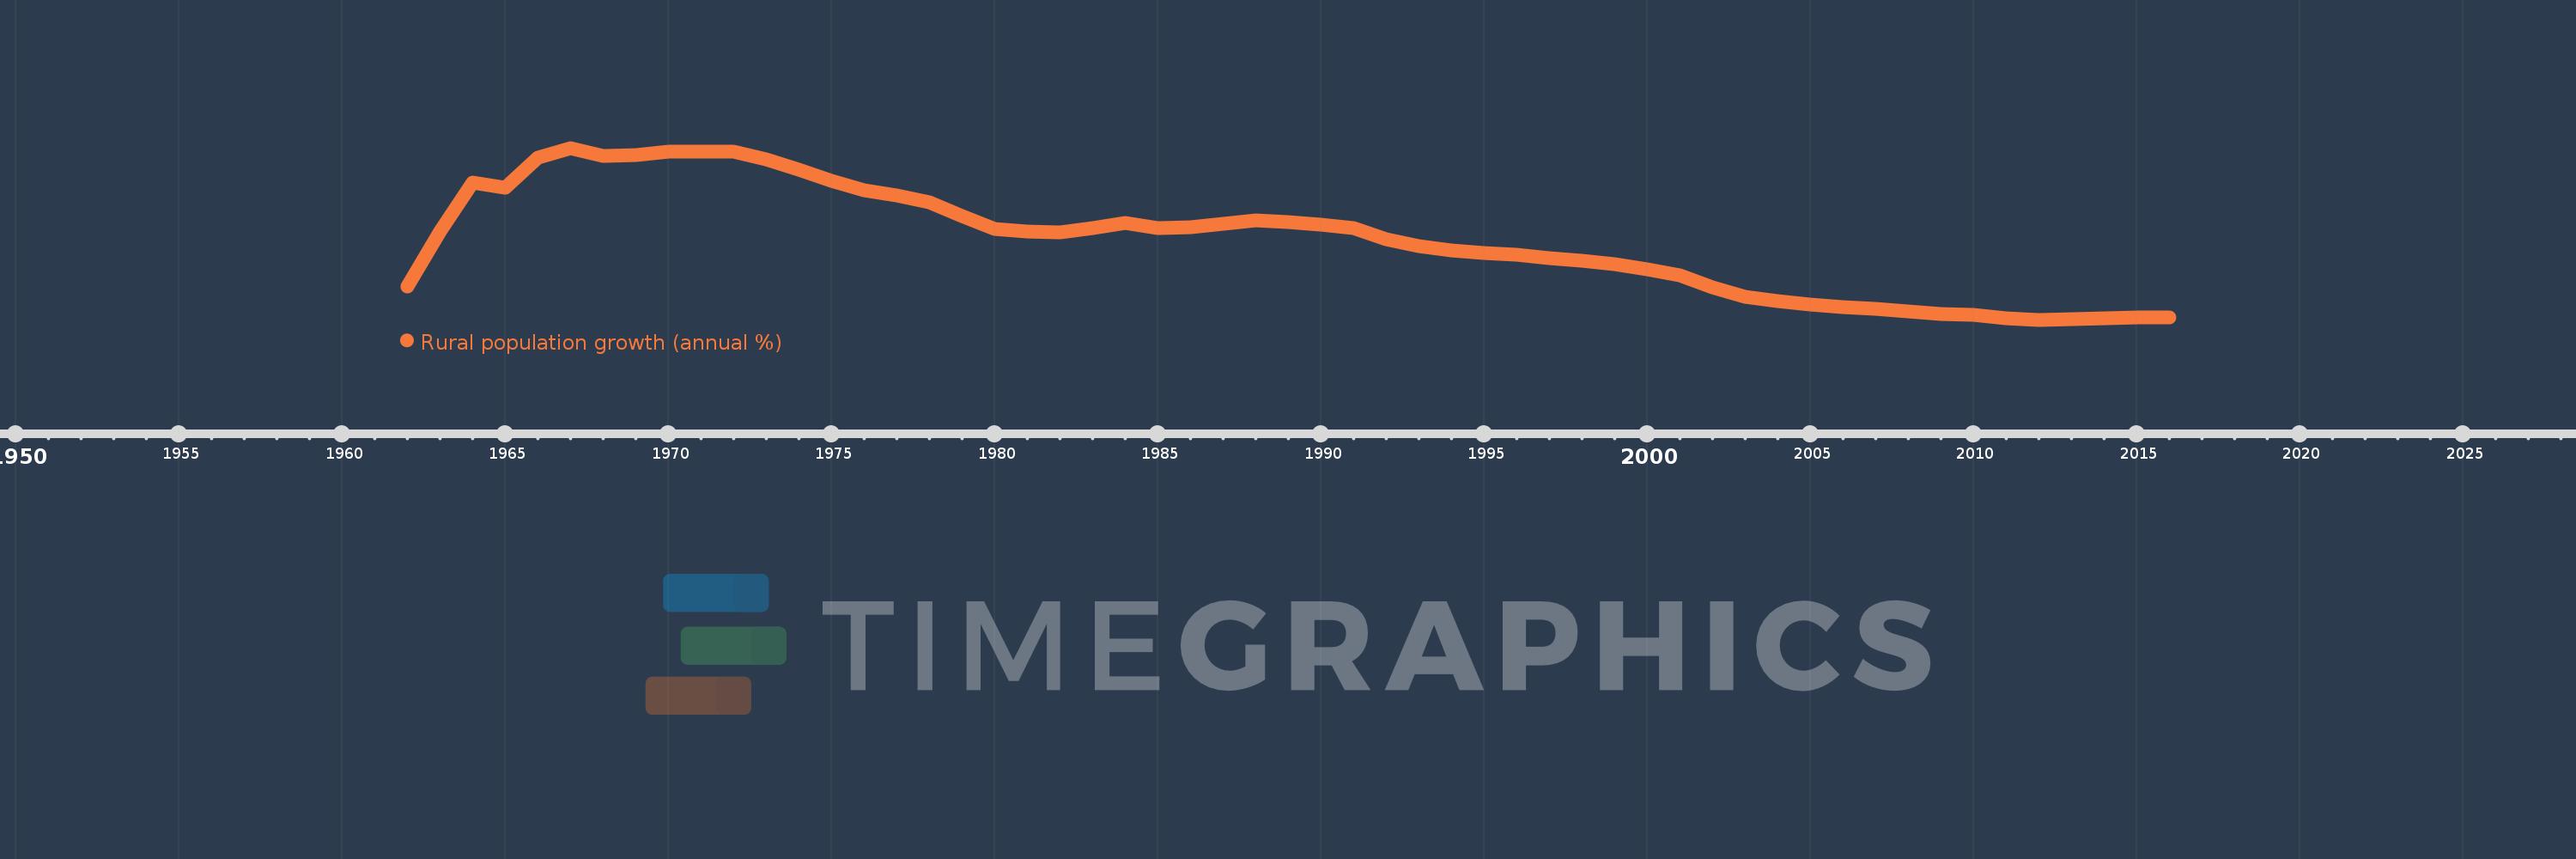
Late-demographic dividend
LTE
false
2
1
Rural population growth (annual %)
2016,2015,2014,2013,2012,2011,2010,2009,2008,2007,2006,2005,2004,2003,2002,2001,2000,1999,1998,1997,1996,1995,1994,1993,1992,1991,1990,1989,1988,1987,1986,1985,1984,1983,1982,1981,1980,1979,1978,1977,1976,1975,1974,1973,1972,1971,1970,1969,1968,1967,1966,1965,1964,1963,1962
Queste statistiche in altri paesi:
AfghanistanAlbaniaAlgeriaAmerican SamoaAndorraAngolaAntigua and BarbudaArab WorldArgentinaArmeniaArubaAustraliaAustriaAzerbaijanBahamas, TheBahrainBangladeshBarbadosBelarusBelgiumBelizeBeninBhutanBoliviaBosnia and HerzegovinaBotswanaBrazilBritish Virgin IslandsBrunei DarussalamBulgariaBurkina FasoBurundiCabo VerdeCambodiaCameroonCanadaCaribbean small statesCentral African RepublicCentral Europe and the BalticsChadChannel IslandsChileChinaColombiaComorosCongo, Dem. Rep.Congo, Rep.Costa RicaCote d'IvoireCroatiaCubaCuracaoCyprusCzech RepublicDenmarkDjiboutiDominicaDominican RepublicEarly-demographic dividendEast Asia & PacificEast Asia & Pacific (excluding high income)East Asia & Pacific (IDA & IBRD countries)EcuadorEgypt, Arab Rep.El SalvadorEquatorial GuineaEritreaEstoniaEthiopiaEuro areaEurope & Central AsiaEurope & Central Asia (excluding high income)Europe & Central Asia (IDA & IBRD countries)European UnionFaroe IslandsFijiFinlandFragile and conflict affected situationsFranceFrench PolynesiaGabonGambia, TheGeorgiaGermanyGhanaGreeceGreenlandGrenadaGuamGuatemalaGuineaGuinea-BissauGuyanaHaitiHeavily indebted poor countries (HIPC)High incomeHondurasHong Kong SAR, ChinaHungaryIBRD onlyIcelandIDA & IBRD totalIDA blendIDA onlyIDA totalIndiaIndonesiaIran, Islamic Rep.IraqIrelandIsle of ManIsraelItalyJamaicaJapanJordanKazakhstanKenyaKiribatiKorea, Dem. People’s Rep.Korea, Rep.KuwaitKyrgyz RepublicLao PDRLate-demographic dividendLatin America & Caribbean Latin America & Caribbean (excluding high income)Latin America & the Caribbean (IDA & IBRD countries)LatviaLeast developed countries: UN classificationLebanonLesothoLiberiaLibyaLiechtensteinLithuaniaLow & middle incomeLow incomeLower middle incomeLuxembourgMacao SAR, ChinaMacedonia, FYRMadagascarMalawiMalaysiaMaldivesMaliMaltaMarshall IslandsMauritaniaMauritiusMexicoMicronesia, Fed. Sts.Middle East & North AfricaMiddle East & North Africa (excluding high income)Middle East & North Africa (IDA & IBRD countries)Middle incomeMoldovaMongoliaMontenegroMoroccoMozambiqueMyanmarNamibiaNauruNepalNetherlandsNew CaledoniaNew ZealandNicaraguaNigerNigeriaNorth AmericaNorthern Mariana IslandsNorwayOECD membersOmanOther small statesPacific island small statesPakistanPalauPanamaPapua New GuineaParaguayPeruPhilippinesPolandPortugalPost-demographic dividendPre-demographic dividendPuerto RicoQatarRomaniaRussian FederationRwandaSamoaSan MarinoSao Tome and PrincipeSaudi ArabiaSenegalSerbiaSeychellesSierra LeoneSlovak RepublicSloveniaSmall statesSolomon IslandsSomaliaSouth AfricaSouth AsiaSouth Asia (IDA & IBRD)South SudanSpainSri LankaSt. Kitts and NevisSt. LuciaSt. Vincent and the GrenadinesSub-Saharan Africa Sub-Saharan Africa (excluding high income)Sub-Saharan Africa (IDA & IBRD countries)SudanSurinameSwazilandSwedenSwitzerlandSyrian Arab RepublicTajikistanTanzaniaThailandTimor-LesteTogoTongaTrinidad and TobagoTunisiaTurkeyTurkmenistanTurks and Caicos IslandsTuvaluUgandaUkraineUnited Arab EmiratesUnited KingdomUnited StatesUpper middle incomeUruguayUzbekistanVanuatuVenezuela, RBVietnamVirgin Islands (U.S.)West Bank and GazaWorldYemen, Rep.ZambiaZimbabwe Linea del tempo:
Questa scala temporale mostra un grafico dal 1962 anno al 2016 anno. Late-demographic dividend. I dati fino ad 1961 anno non disponibili. Il numero di osservazioni attuali secondo i date: 55.
La fonte (nome):
Indicatori dello sviluppo mondiale
La fonte (organizzazione):
World Bank Staff estimates based on United Nations, World Urbanization Prospects.
Categorie:
Agriculture & Rural Development
sono stati aggiornati
23 apr 2017 anni
Indicatori delle variazioni dei valori per anni
Minima:
-1.596
1 gen 2012 anni
Massimo:
2.29
1 gen 1967 anni
Alla data di osservazione
Valore
Variazione assoluta
La variazione rispetto al valore precedente
1 gen 1962 anni
-0.837
-0.837
0.0%
1 gen 1963 anni
0.403
+1.24
-148.23%
1 gen 1964 anni
1.499
+1.096
271.59%
1 gen 1965 anni
1.4
-0.099
-6.61%
1 gen 1966 anni
2.073
+0.673
48.08%
1 gen 1967 anni
2.29
+0.217
10.47%
1 gen 1968 anni
2.114
-0.176
-7.69%
1 gen 1969 anni
2.126
+0.012
0.55%
1 gen 1970 anni
2.203
+0.077
3.62%
1 gen 1971 anni
2.207
+0.004
0.16%
1 gen 1972 anni
2.215
+0.009
0.4%
1 gen 1973 anni
2.028
-0.188
-8.48%
1 gen 1974 anni
1.805
-0.222
-10.96%
1 gen 1975 anni
1.545
-0.26
-14.4%
1 gen 1976 anni
1.328
-0.217
-14.04%
1 gen 1977 anni
1.215
-0.113
-8.51%
1 gen 1978 anni
1.066
-0.149
-12.27%
1 gen 1979 anni
0.748
-0.318
-29.82%
1 gen 1980 anni
0.454
-0.294
-39.31%
1 gen 1981 anni
0.391
-0.063
-13.83%
1 gen 1982 anni
0.371
-0.02
-5.09%
1 gen 1983 anni
0.485
+0.113
30.5%
1 gen 1984 anni
0.588
+0.103
21.21%
1 gen 1985 anni
0.471
-0.116
-19.76%
1 gen 1986 anni
0.5
+0.028
6.02%
1 gen 1987 anni
0.583
+0.083
16.56%
1 gen 1988 anni
0.646
+0.064
10.94%
1 gen 1989 anni
0.615
-0.031
-4.86%
1 gen 1990 anni
0.562
-0.053
-8.57%
1 gen 1991 anni
0.471
-0.091
-16.21%
1 gen 1992 anni
0.229
-0.242
-51.42%
1 gen 1993 anni
0.069
-0.16
-69.94%
1 gen 1994 anni
-0.027
-0.096
-139.05%
1 gen 1995 anni
-0.079
-0.052
193.73%
1 gen 1996 anni
-0.133
-0.054
68.84%
1 gen 1997 anni
-0.199
-0.066
49.7%
1 gen 1998 anni
-0.26
-0.06
30.28%
1 gen 1999 anni
-0.342
-0.082
31.58%
1 gen 2000 anni
-0.447
-0.105
30.77%
1 gen 2001 anni
-0.585
-0.138
30.77%
1 gen 2002 anni
-0.873
-0.289
49.39%
1 gen 2003 anni
-1.085
-0.212
24.29%
1 gen 2004 anni
-1.173
-0.088
8.11%
1 gen 2005 anni
-1.25
-0.077
6.57%
1 gen 2006 anni
-1.314
-0.064
5.12%
1 gen 2007 anni
-1.345
-0.031
2.33%
1 gen 2008 anni
-1.402
-0.057
4.25%
1 gen 2009 anni
-1.457
-0.055
3.93%
1 gen 2010 anni
-1.488
-0.031
2.14%
1 gen 2011 anni
-1.561
-0.073
4.88%
1 gen 2012 anni
-1.596
-0.035
2.22%
1 gen 2013 anni
-1.581
+0.014
-0.89%
1 gen 2014 anni
-1.567
+0.014
-0.91%
1 gen 2015 anni
-1.549
+0.018
-1.16%
1 gen 2016 anni
-1.543
+0.006
-0.39%
Classificazione dei paesi secondo i statistiche attuali per anni


Commenti: