29
/it/
it
AIzaSyAYiBZKx7MnpbEhh9jyipgxe19OcubqV5w
April 1, 2024
266307
Tonga
TON
true
2
1
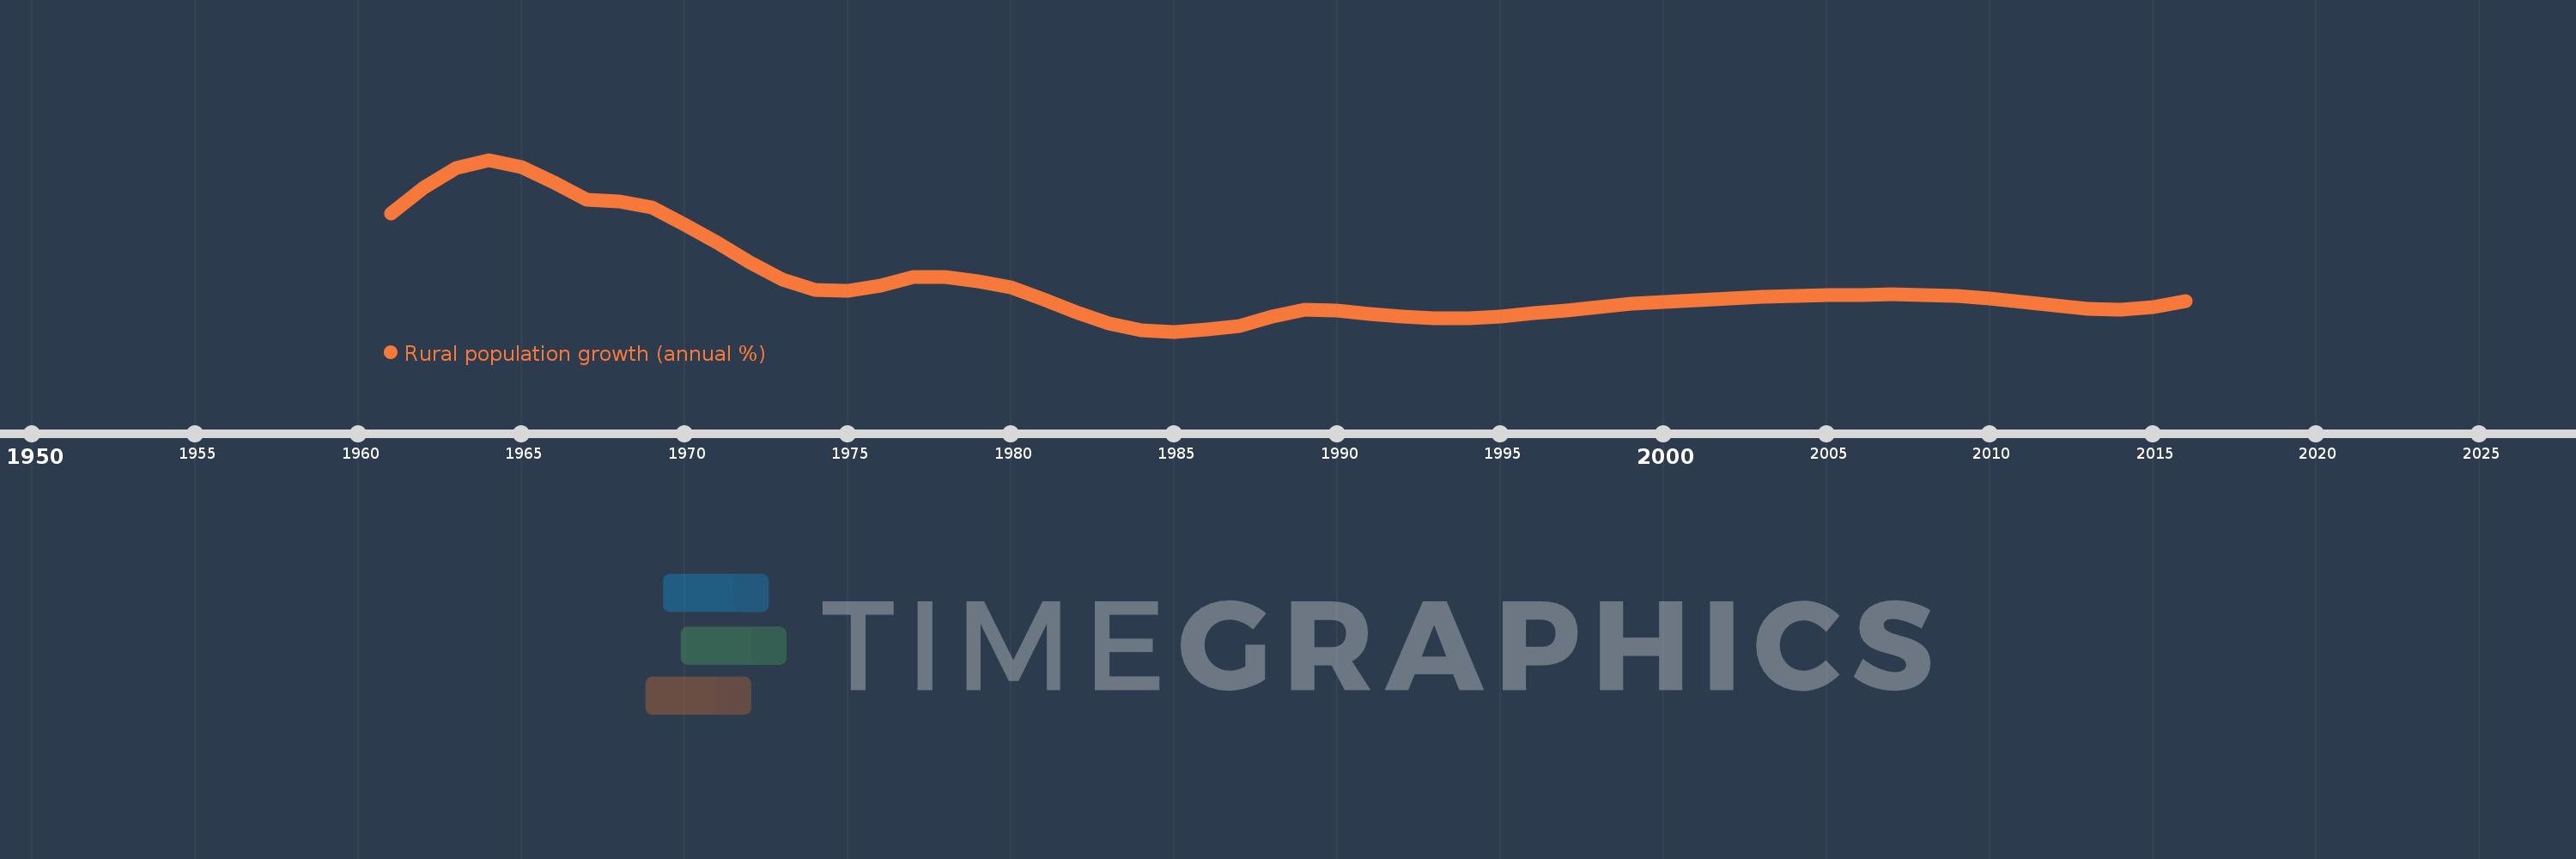
Rural population growth (annual %)
2016,2015,2014,2013,2012,2011,2010,2009,2008,2007,2006,2005,2004,2003,2002,2001,2000,1999,1998,1997,1996,1995,1994,1993,1992,1991,1990,1989,1988,1987,1986,1985,1984,1983,1982,1981,1980,1979,1978,1977,1976,1975,1974,1973,1972,1971,1970,1969,1968,1967,1966,1965,1964,1963,1962,1961
Queste statistiche in altri paesi:
AfghanistanAlbaniaAlgeriaAmerican SamoaAndorraAngolaAntigua and BarbudaArab WorldArgentinaArmeniaArubaAustraliaAustriaAzerbaijanBahamas, TheBahrainBangladeshBarbadosBelarusBelgiumBelizeBeninBhutanBoliviaBosnia and HerzegovinaBotswanaBrazilBritish Virgin IslandsBrunei DarussalamBulgariaBurkina FasoBurundiCabo VerdeCambodiaCameroonCanadaCaribbean small statesCentral African RepublicCentral Europe and the BalticsChadChannel IslandsChileChinaColombiaComorosCongo, Dem. Rep.Congo, Rep.Costa RicaCote d'IvoireCroatiaCubaCuracaoCyprusCzech RepublicDenmarkDjiboutiDominicaDominican RepublicEarly-demographic dividendEast Asia & PacificEast Asia & Pacific (excluding high income)East Asia & Pacific (IDA & IBRD countries)EcuadorEgypt, Arab Rep.El SalvadorEquatorial GuineaEritreaEstoniaEthiopiaEuro areaEurope & Central AsiaEurope & Central Asia (excluding high income)Europe & Central Asia (IDA & IBRD countries)European UnionFaroe IslandsFijiFinlandFragile and conflict affected situationsFranceFrench PolynesiaGabonGambia, TheGeorgiaGermanyGhanaGreeceGreenlandGrenadaGuamGuatemalaGuineaGuinea-BissauGuyanaHaitiHeavily indebted poor countries (HIPC)High incomeHondurasHong Kong SAR, ChinaHungaryIBRD onlyIcelandIDA & IBRD totalIDA blendIDA onlyIDA totalIndiaIndonesiaIran, Islamic Rep.IraqIrelandIsle of ManIsraelItalyJamaicaJapanJordanKazakhstanKenyaKiribatiKorea, Dem. People’s Rep.Korea, Rep.KuwaitKyrgyz RepublicLao PDRLate-demographic dividendLatin America & Caribbean Latin America & Caribbean (excluding high income)Latin America & the Caribbean (IDA & IBRD countries)LatviaLeast developed countries: UN classificationLebanonLesothoLiberiaLibyaLiechtensteinLithuaniaLow & middle incomeLow incomeLower middle incomeLuxembourgMacao SAR, ChinaMacedonia, FYRMadagascarMalawiMalaysiaMaldivesMaliMaltaMarshall IslandsMauritaniaMauritiusMexicoMicronesia, Fed. Sts.Middle East & North AfricaMiddle East & North Africa (excluding high income)Middle East & North Africa (IDA & IBRD countries)Middle incomeMoldovaMongoliaMontenegroMoroccoMozambiqueMyanmarNamibiaNauruNepalNetherlandsNew CaledoniaNew ZealandNicaraguaNigerNigeriaNorth AmericaNorthern Mariana IslandsNorwayOECD membersOmanOther small statesPacific island small statesPakistanPalauPanamaPapua New GuineaParaguayPeruPhilippinesPolandPortugalPost-demographic dividendPre-demographic dividendPuerto RicoQatarRomaniaRussian FederationRwandaSamoaSan MarinoSao Tome and PrincipeSaudi ArabiaSenegalSerbiaSeychellesSierra LeoneSlovak RepublicSloveniaSmall statesSolomon IslandsSomaliaSouth AfricaSouth AsiaSouth Asia (IDA & IBRD)South SudanSpainSri LankaSt. Kitts and NevisSt. LuciaSt. Vincent and the GrenadinesSub-Saharan Africa Sub-Saharan Africa (excluding high income)Sub-Saharan Africa (IDA & IBRD countries)SudanSurinameSwazilandSwedenSwitzerlandSyrian Arab RepublicTajikistanTanzaniaThailandTimor-LesteTogoTongaTrinidad and TobagoTunisiaTurkeyTurkmenistanTurks and Caicos IslandsTuvaluUgandaUkraineUnited Arab EmiratesUnited KingdomUnited StatesUpper middle incomeUruguayUzbekistanVanuatuVenezuela, RBVietnamVirgin Islands (U.S.)West Bank and GazaWorldYemen, Rep.ZambiaZimbabwe Linea del tempo:
Questa scala temporale mostra un grafico dal 1961 anno al 2016 anno. Tonga. I dati fino ad 1960 anno non disponibili. Il numero di osservazioni attuali secondo i date: 56.
La fonte (nome):
Indicatori dello sviluppo mondiale
La fonte (organizzazione):
World Bank Staff estimates based on United Nations, World Urbanization Prospects.
Categorie:
Agriculture & Rural Development
sono stati aggiornati
23 apr 2017 anni
Indicatori delle variazioni dei valori per anni
Minima:
-0.221
1 gen 1985 anni
Massimo:
3.582
1 gen 1964 anni
Alla data di osservazione
Valore
Variazione assoluta
La variazione rispetto al valore precedente
1 gen 1961 anni
2.393
+2.393
0.0%
1 gen 1962 anni
2.957
+0.563
23.54%
1 gen 1963 anni
3.401
+0.445
15.05%
1 gen 1964 anni
3.582
+0.181
5.32%
1 gen 1965 anni
3.429
-0.153
-4.28%
1 gen 1966 anni
3.07
-0.359
-10.47%
1 gen 1967 anni
2.698
-0.372
-12.13%
1 gen 1968 anni
2.667
-0.031
-1.16%
1 gen 1969 anni
2.52
-0.146
-5.49%
1 gen 1970 anni
2.137
-0.383
-15.21%
1 gen 1971 anni
1.745
-0.392
-18.33%
1 gen 1972 anni
1.316
-0.429
-24.6%
1 gen 1973 anni
0.928
-0.388
-29.49%
1 gen 1974 anni
0.696
-0.232
-24.98%
1 gen 1975 anni
0.677
-0.019
-2.75%
1 gen 1976 anni
0.802
+0.125
18.44%
1 gen 1977 anni
0.988
+0.187
23.27%
1 gen 1978 anni
0.984
-0.004
-0.41%
1 gen 1979 anni
0.9
-0.084
-8.55%
1 gen 1980 anni
0.75
-0.15
-16.71%
1 gen 1981 anni
0.487
-0.263
-35.08%
1 gen 1982 anni
0.2
-0.286
-58.85%
1 gen 1983 anni
-0.035
-0.236
-117.67%
1 gen 1984 anni
-0.187
-0.151
427.51%
1 gen 1985 anni
-0.221
-0.035
18.49%
1 gen 1986 anni
-0.167
+0.054
-24.55%
1 gen 1987 anni
-0.088
+0.079
-47.47%
1 gen 1988 anni
0.121
+0.208
-237.48%
1 gen 1989 anni
0.257
+0.136
113.23%
1 gen 1990 anni
0.237
-0.02
-7.68%
1 gen 1991 anni
0.178
-0.059
-24.87%
1 gen 1992 anni
0.118
-0.06
-33.69%
1 gen 1993 anni
0.081
-0.037
-31.1%
1 gen 1994 anni
0.075
-0.007
-8.4%
1 gen 1995 anni
0.111
+0.037
48.95%
1 gen 1996 anni
0.179
+0.067
60.74%
1 gen 1997 anni
0.254
+0.075
42.12%
1 gen 1998 anni
0.326
+0.072
28.35%
1 gen 1999 anni
0.389
+0.063
19.41%
1 gen 2000 anni
0.437
+0.048
12.29%
1 gen 2001 anni
0.476
+0.039
8.98%
1 gen 2002 anni
0.508
+0.032
6.74%
1 gen 2003 anni
0.542
+0.034
6.73%
1 gen 2004 anni
0.567
+0.024
4.52%
1 gen 2005 anni
0.583
+0.016
2.87%
1 gen 2006 anni
0.591
+0.008
1.41%
1 gen 2007 anni
0.605
+0.013
2.23%
1 gen 2008 anni
0.593
-0.011
-1.87%
1 gen 2009 anni
0.561
-0.033
-5.5%
1 gen 2010 anni
0.512
-0.049
-8.65%
1 gen 2011 anni
0.442
-0.07
-13.75%
1 gen 2012 anni
0.356
-0.086
-19.41%
1 gen 2013 anni
0.289
-0.067
-18.92%
1 gen 2014 anni
0.272
-0.017
-5.89%
1 gen 2015 anni
0.33
+0.059
21.65%
1 gen 2016 anni
0.447
+0.116
35.19%
Classificazione dei paesi secondo i statistiche attuali per anni


Commenti: