29
/it/
it
AIzaSyAYiBZKx7MnpbEhh9jyipgxe19OcubqV5w
April 1, 2024
282968
Vietnam
VNM
true
2
1
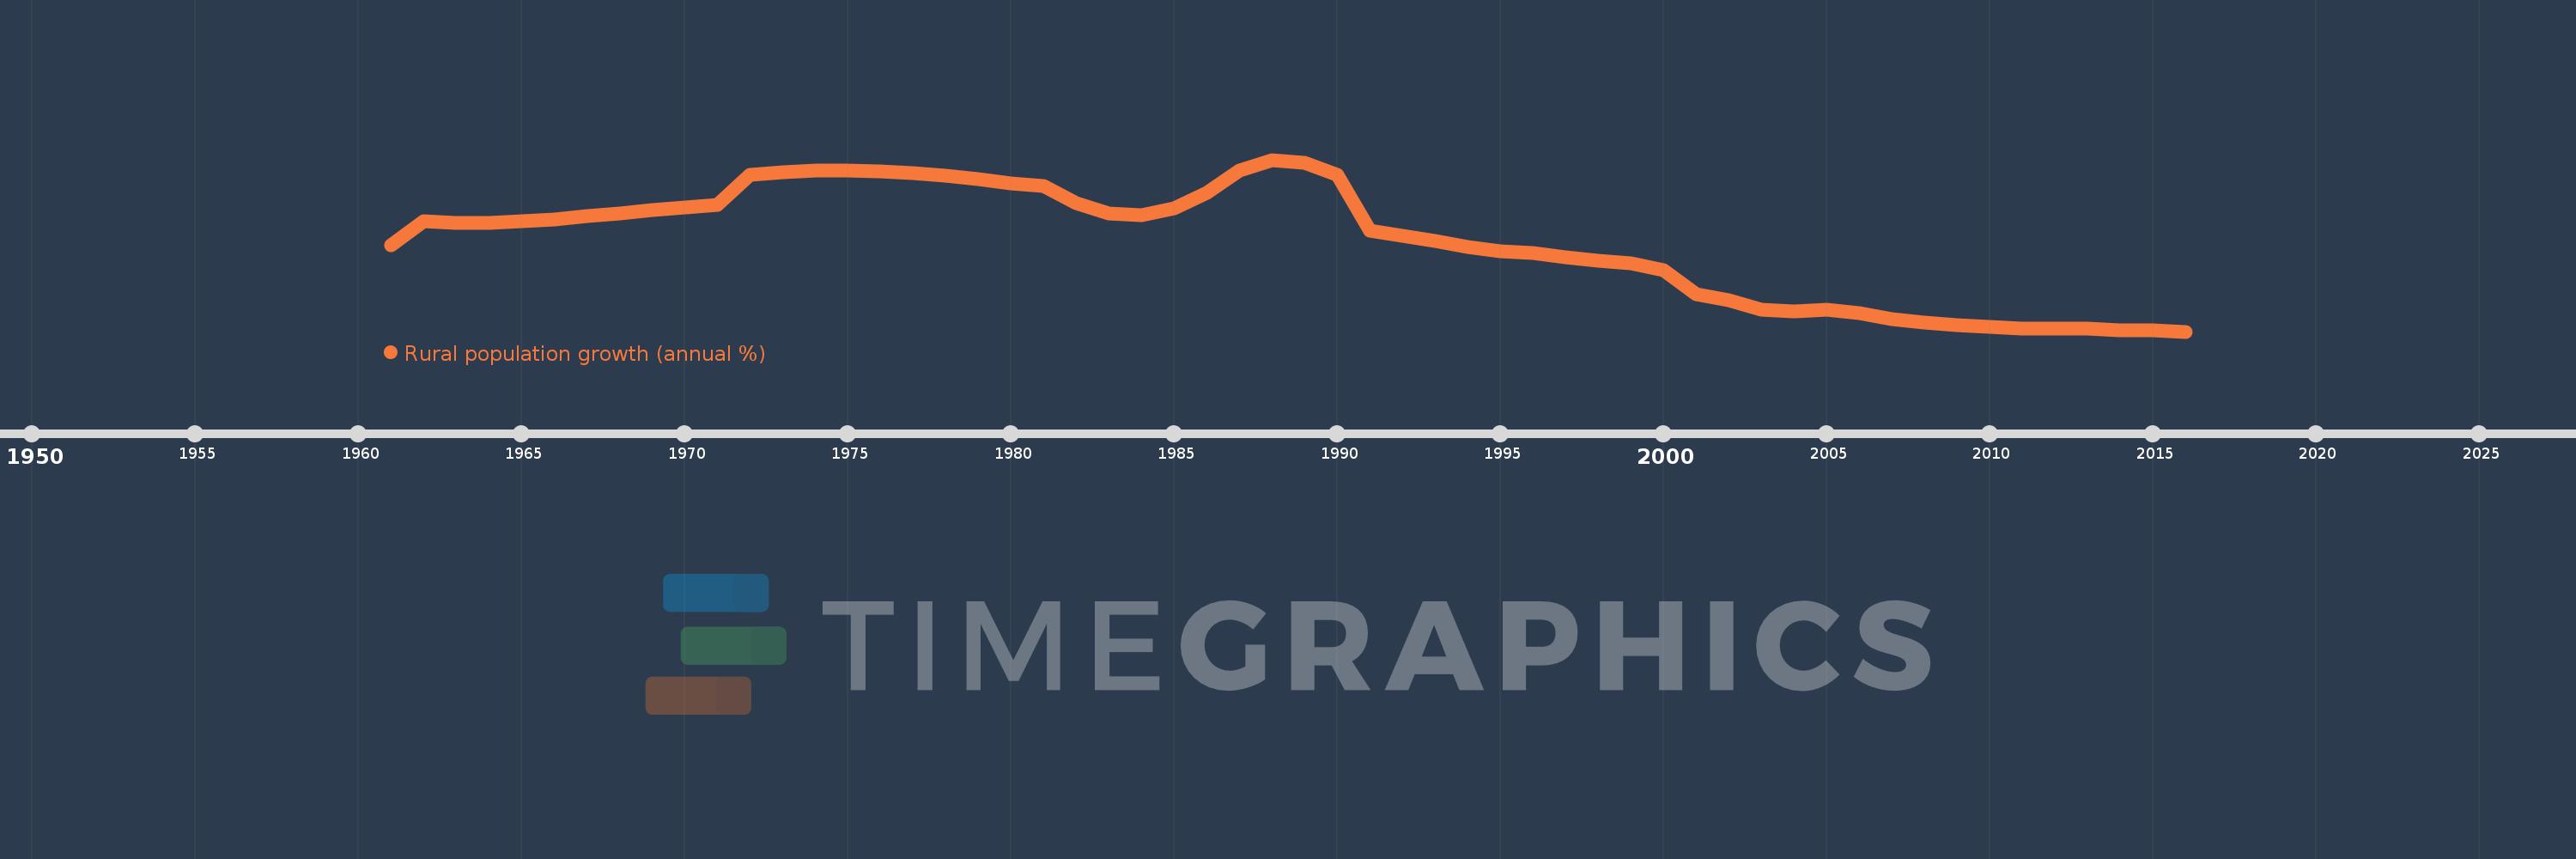
Rural population growth (annual %)
2016,2015,2014,2013,2012,2011,2010,2009,2008,2007,2006,2005,2004,2003,2002,2001,2000,1999,1998,1997,1996,1995,1994,1993,1992,1991,1990,1989,1988,1987,1986,1985,1984,1983,1982,1981,1980,1979,1978,1977,1976,1975,1974,1973,1972,1971,1970,1969,1968,1967,1966,1965,1964,1963,1962,1961
Queste statistiche in altri paesi:
AfghanistanAlbaniaAlgeriaAmerican SamoaAndorraAngolaAntigua and BarbudaArab WorldArgentinaArmeniaArubaAustraliaAustriaAzerbaijanBahamas, TheBahrainBangladeshBarbadosBelarusBelgiumBelizeBeninBhutanBoliviaBosnia and HerzegovinaBotswanaBrazilBritish Virgin IslandsBrunei DarussalamBulgariaBurkina FasoBurundiCabo VerdeCambodiaCameroonCanadaCaribbean small statesCentral African RepublicCentral Europe and the BalticsChadChannel IslandsChileChinaColombiaComorosCongo, Dem. Rep.Congo, Rep.Costa RicaCote d'IvoireCroatiaCubaCuracaoCyprusCzech RepublicDenmarkDjiboutiDominicaDominican RepublicEarly-demographic dividendEast Asia & PacificEast Asia & Pacific (excluding high income)East Asia & Pacific (IDA & IBRD countries)EcuadorEgypt, Arab Rep.El SalvadorEquatorial GuineaEritreaEstoniaEthiopiaEuro areaEurope & Central AsiaEurope & Central Asia (excluding high income)Europe & Central Asia (IDA & IBRD countries)European UnionFaroe IslandsFijiFinlandFragile and conflict affected situationsFranceFrench PolynesiaGabonGambia, TheGeorgiaGermanyGhanaGreeceGreenlandGrenadaGuamGuatemalaGuineaGuinea-BissauGuyanaHaitiHeavily indebted poor countries (HIPC)High incomeHondurasHong Kong SAR, ChinaHungaryIBRD onlyIcelandIDA & IBRD totalIDA blendIDA onlyIDA totalIndiaIndonesiaIran, Islamic Rep.IraqIrelandIsle of ManIsraelItalyJamaicaJapanJordanKazakhstanKenyaKiribatiKorea, Dem. People’s Rep.Korea, Rep.KuwaitKyrgyz RepublicLao PDRLate-demographic dividendLatin America & Caribbean Latin America & Caribbean (excluding high income)Latin America & the Caribbean (IDA & IBRD countries)LatviaLeast developed countries: UN classificationLebanonLesothoLiberiaLibyaLiechtensteinLithuaniaLow & middle incomeLow incomeLower middle incomeLuxembourgMacao SAR, ChinaMacedonia, FYRMadagascarMalawiMalaysiaMaldivesMaliMaltaMarshall IslandsMauritaniaMauritiusMexicoMicronesia, Fed. Sts.Middle East & North AfricaMiddle East & North Africa (excluding high income)Middle East & North Africa (IDA & IBRD countries)Middle incomeMoldovaMongoliaMontenegroMoroccoMozambiqueMyanmarNamibiaNauruNepalNetherlandsNew CaledoniaNew ZealandNicaraguaNigerNigeriaNorth AmericaNorthern Mariana IslandsNorwayOECD membersOmanOther small statesPacific island small statesPakistanPalauPanamaPapua New GuineaParaguayPeruPhilippinesPolandPortugalPost-demographic dividendPre-demographic dividendPuerto RicoQatarRomaniaRussian FederationRwandaSamoaSan MarinoSao Tome and PrincipeSaudi ArabiaSenegalSerbiaSeychellesSierra LeoneSlovak RepublicSloveniaSmall statesSolomon IslandsSomaliaSouth AfricaSouth AsiaSouth Asia (IDA & IBRD)South SudanSpainSri LankaSt. Kitts and NevisSt. LuciaSt. Vincent and the GrenadinesSub-Saharan Africa Sub-Saharan Africa (excluding high income)Sub-Saharan Africa (IDA & IBRD countries)SudanSurinameSwazilandSwedenSwitzerlandSyrian Arab RepublicTajikistanTanzaniaThailandTimor-LesteTogoTongaTrinidad and TobagoTunisiaTurkeyTurkmenistanTurks and Caicos IslandsTuvaluUgandaUkraineUnited Arab EmiratesUnited KingdomUnited StatesUpper middle incomeUruguayUzbekistanVanuatuVenezuela, RBVietnamVirgin Islands (U.S.)West Bank and GazaWorldYemen, Rep.ZambiaZimbabwe Linea del tempo:
Questa scala temporale mostra un grafico dal 1961 anno al 2016 anno. Vietnam. I dati fino ad 1960 anno non disponibili. Il numero di osservazioni attuali secondo i date: 56.
La fonte (nome):
Indicatori dello sviluppo mondiale
La fonte (organizzazione):
World Bank Staff estimates based on United Nations, World Urbanization Prospects.
Categorie:
Agriculture & Rural Development
sono stati aggiornati
23 apr 2017 anni
Indicatori delle variazioni dei valori per anni
Minima:
0.107
1 gen 2016 anni
Massimo:
2.382
1 gen 1988 anni
Alla data di osservazione
Valore
Variazione assoluta
La variazione rispetto al valore precedente
1 gen 1961 anni
1.249
+1.249
0.0%
1 gen 1962 anni
1.564
+0.315
25.21%
1 gen 1963 anni
1.544
-0.019
-1.25%
1 gen 1964 anni
1.546
+0.002
0.13%
1 gen 1965 anni
1.568
+0.021
1.39%
1 gen 1966 anni
1.595
+0.027
1.72%
1 gen 1967 anni
1.632
+0.038
2.37%
1 gen 1968 anni
1.674
+0.042
2.55%
1 gen 1969 anni
1.713
+0.039
2.31%
1 gen 1970 anni
1.755
+0.043
2.5%
1 gen 1971 anni
1.788
+0.032
1.84%
1 gen 1972 anni
2.187
+0.399
22.31%
1 gen 1973 anni
2.217
+0.031
1.4%
1 gen 1974 anni
2.238
+0.021
0.94%
1 gen 1975 anni
2.238
0.0
-0.01%
1 gen 1976 anni
2.223
-0.015
-0.66%
1 gen 1977 anni
2.201
-0.022
-1.01%
1 gen 1978 anni
2.166
-0.035
-1.59%
1 gen 1979 anni
2.122
-0.043
-2.01%
1 gen 1980 anni
2.066
-0.056
-2.65%
1 gen 1981 anni
2.03
-0.036
-1.74%
1 gen 1982 anni
1.808
-0.222
-10.91%
1 gen 1983 anni
1.67
-0.138
-7.66%
1 gen 1984 anni
1.645
-0.025
-1.48%
1 gen 1985 anni
1.736
+0.09
5.5%
1 gen 1986 anni
1.94
+0.204
11.76%
1 gen 1987 anni
2.239
+0.3
15.45%
1 gen 1988 anni
2.382
+0.143
6.39%
1 gen 1989 anni
2.341
-0.041
-1.74%
1 gen 1990 anni
2.188
-0.153
-6.52%
1 gen 1991 anni
1.444
-0.745
-34.03%
1 gen 1992 anni
1.375
-0.069
-4.79%
1 gen 1993 anni
1.307
-0.068
-4.95%
1 gen 1994 anni
1.226
-0.08
-6.16%
1 gen 1995 anni
1.166
-0.06
-4.89%
1 gen 1996 anni
1.144
-0.022
-1.92%
1 gen 1997 anni
1.095
-0.049
-4.27%
1 gen 1998 anni
1.049
-0.046
-4.24%
1 gen 1999 anni
1.012
-0.037
-3.51%
1 gen 2000 anni
0.923
-0.089
-8.79%
1 gen 2001 anni
0.607
-0.315
-34.19%
1 gen 2002 anni
0.519
-0.088
-14.47%
1 gen 2003 anni
0.392
-0.127
-24.49%
1 gen 2004 anni
0.379
-0.013
-3.36%
1 gen 2005 anni
0.394
+0.015
3.98%
1 gen 2006 anni
0.348
-0.046
-11.78%
1 gen 2007 anni
0.271
-0.077
-22.03%
1 gen 2008 anni
0.225
-0.046
-16.91%
1 gen 2009 anni
0.187
-0.039
-17.16%
1 gen 2010 anni
0.166
-0.02
-10.93%
1 gen 2011 anni
0.143
-0.024
-14.14%
1 gen 2012 anni
0.142
0.0
-0.31%
1 gen 2013 anni
0.143
+0.001
0.81%
1 gen 2014 anni
0.122
-0.022
-15.03%
1 gen 2015 anni
0.121
-0.001
-0.5%
1 gen 2016 anni
0.107
-0.015
-12.03%
Classificazione dei paesi secondo i statistiche attuali per anni


Commenti: