29
/it/
it
AIzaSyAYiBZKx7MnpbEhh9jyipgxe19OcubqV5w
April 1, 2024
124176
Ecuador
ECU
true
2
1
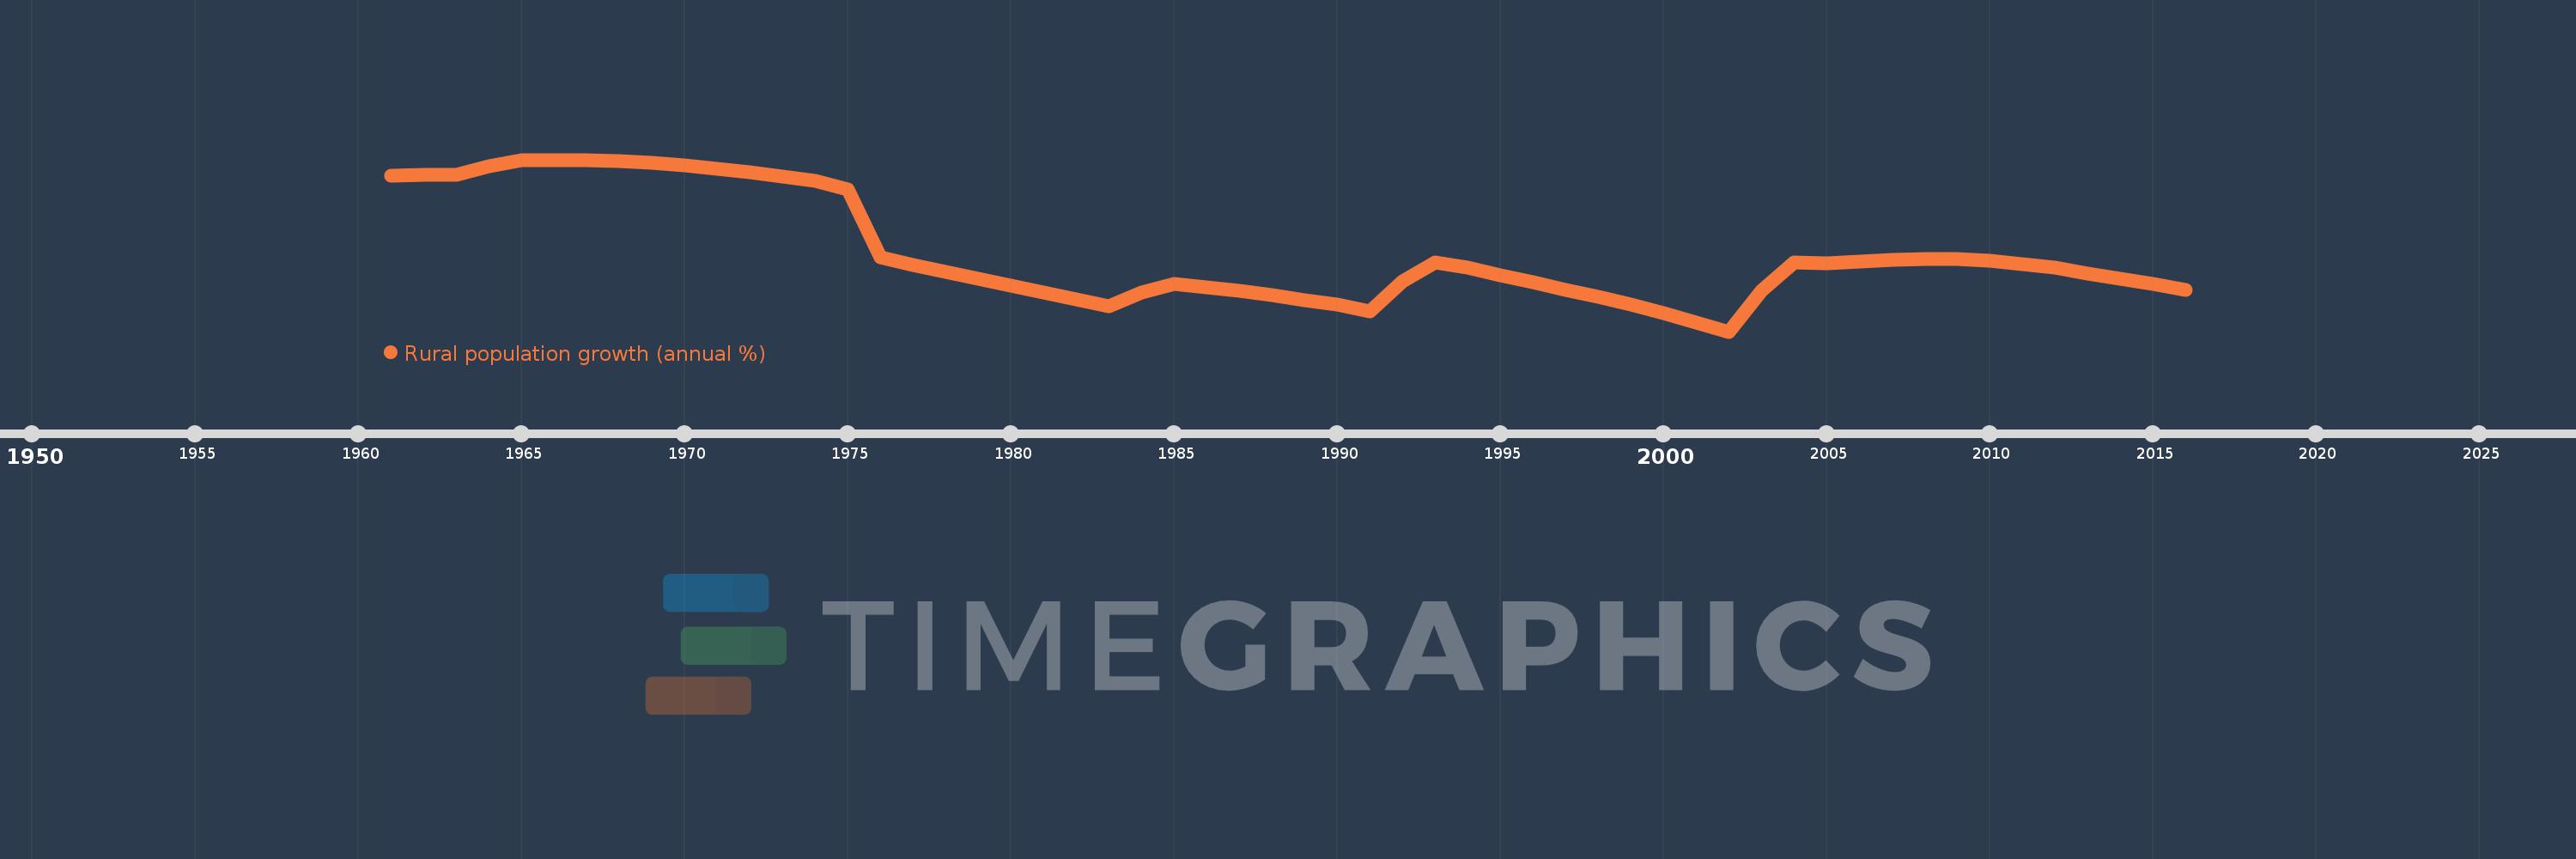
Rural population growth (annual %)
2016,2015,2014,2013,2012,2011,2010,2009,2008,2007,2006,2005,2004,2003,2002,2001,2000,1999,1998,1997,1996,1995,1994,1993,1992,1991,1990,1989,1988,1987,1986,1985,1984,1983,1982,1981,1980,1979,1978,1977,1976,1975,1974,1973,1972,1971,1970,1969,1968,1967,1966,1965,1964,1963,1962,1961
Queste statistiche in altri paesi:
AfghanistanAlbaniaAlgeriaAmerican SamoaAndorraAngolaAntigua and BarbudaArab WorldArgentinaArmeniaArubaAustraliaAustriaAzerbaijanBahamas, TheBahrainBangladeshBarbadosBelarusBelgiumBelizeBeninBhutanBoliviaBosnia and HerzegovinaBotswanaBrazilBritish Virgin IslandsBrunei DarussalamBulgariaBurkina FasoBurundiCabo VerdeCambodiaCameroonCanadaCaribbean small statesCentral African RepublicCentral Europe and the BalticsChadChannel IslandsChileChinaColombiaComorosCongo, Dem. Rep.Congo, Rep.Costa RicaCote d'IvoireCroatiaCubaCuracaoCyprusCzech RepublicDenmarkDjiboutiDominicaDominican RepublicEarly-demographic dividendEast Asia & PacificEast Asia & Pacific (excluding high income)East Asia & Pacific (IDA & IBRD countries)EcuadorEgypt, Arab Rep.El SalvadorEquatorial GuineaEritreaEstoniaEthiopiaEuro areaEurope & Central AsiaEurope & Central Asia (excluding high income)Europe & Central Asia (IDA & IBRD countries)European UnionFaroe IslandsFijiFinlandFragile and conflict affected situationsFranceFrench PolynesiaGabonGambia, TheGeorgiaGermanyGhanaGreeceGreenlandGrenadaGuamGuatemalaGuineaGuinea-BissauGuyanaHaitiHeavily indebted poor countries (HIPC)High incomeHondurasHong Kong SAR, ChinaHungaryIBRD onlyIcelandIDA & IBRD totalIDA blendIDA onlyIDA totalIndiaIndonesiaIran, Islamic Rep.IraqIrelandIsle of ManIsraelItalyJamaicaJapanJordanKazakhstanKenyaKiribatiKorea, Dem. People’s Rep.Korea, Rep.KuwaitKyrgyz RepublicLao PDRLate-demographic dividendLatin America & Caribbean Latin America & Caribbean (excluding high income)Latin America & the Caribbean (IDA & IBRD countries)LatviaLeast developed countries: UN classificationLebanonLesothoLiberiaLibyaLiechtensteinLithuaniaLow & middle incomeLow incomeLower middle incomeLuxembourgMacao SAR, ChinaMacedonia, FYRMadagascarMalawiMalaysiaMaldivesMaliMaltaMarshall IslandsMauritaniaMauritiusMexicoMicronesia, Fed. Sts.Middle East & North AfricaMiddle East & North Africa (excluding high income)Middle East & North Africa (IDA & IBRD countries)Middle incomeMoldovaMongoliaMontenegroMoroccoMozambiqueMyanmarNamibiaNauruNepalNetherlandsNew CaledoniaNew ZealandNicaraguaNigerNigeriaNorth AmericaNorthern Mariana IslandsNorwayOECD membersOmanOther small statesPacific island small statesPakistanPalauPanamaPapua New GuineaParaguayPeruPhilippinesPolandPortugalPost-demographic dividendPre-demographic dividendPuerto RicoQatarRomaniaRussian FederationRwandaSamoaSan MarinoSao Tome and PrincipeSaudi ArabiaSenegalSerbiaSeychellesSierra LeoneSlovak RepublicSloveniaSmall statesSolomon IslandsSomaliaSouth AfricaSouth AsiaSouth Asia (IDA & IBRD)South SudanSpainSri LankaSt. Kitts and NevisSt. LuciaSt. Vincent and the GrenadinesSub-Saharan Africa Sub-Saharan Africa (excluding high income)Sub-Saharan Africa (IDA & IBRD countries)SudanSurinameSwazilandSwedenSwitzerlandSyrian Arab RepublicTajikistanTanzaniaThailandTimor-LesteTogoTongaTrinidad and TobagoTunisiaTurkeyTurkmenistanTurks and Caicos IslandsTuvaluUgandaUkraineUnited Arab EmiratesUnited KingdomUnited StatesUpper middle incomeUruguayUzbekistanVanuatuVenezuela, RBVietnamVirgin Islands (U.S.)West Bank and GazaWorldYemen, Rep.ZambiaZimbabwe Linea del tempo:
Questa scala temporale mostra un grafico dal 1961 anno al 2016 anno. Ecuador. I dati fino ad 1960 anno non disponibili. Il numero di osservazioni attuali secondo i date: 56.
La fonte (nome):
Indicatori dello sviluppo mondiale
La fonte (organizzazione):
World Bank Staff estimates based on United Nations, World Urbanization Prospects.
Categorie:
Agriculture & Rural Development
sono stati aggiornati
23 apr 2017 anni
Indicatori delle variazioni dei valori per anni
Minima:
0.492
1 gen 2002 anni
Massimo:
2.097
1 gen 1966 anni
Alla data di osservazione
Valore
Variazione assoluta
La variazione rispetto al valore precedente
1 gen 1961 anni
1.945
+1.945
0.0%
1 gen 1962 anni
1.955
+0.009
0.49%
1 gen 1963 anni
1.957
+0.002
0.1%
1 gen 1964 anni
2.04
+0.083
4.26%
1 gen 1965 anni
2.095
+0.055
2.69%
1 gen 1966 anni
2.097
+0.002
0.11%
1 gen 1967 anni
2.093
-0.004
-0.21%
1 gen 1968 anni
2.086
-0.007
-0.33%
1 gen 1969 anni
2.066
-0.02
-0.95%
1 gen 1970 anni
2.045
-0.021
-1.01%
1 gen 1971 anni
2.009
-0.036
-1.76%
1 gen 1972 anni
1.977
-0.032
-1.6%
1 gen 1973 anni
1.938
-0.039
-1.96%
1 gen 1974 anni
1.901
-0.038
-1.95%
1 gen 1975 anni
1.818
-0.083
-4.34%
1 gen 1976 anni
1.185
-0.633
-34.81%
1 gen 1977 anni
1.114
-0.071
-6.0%
1 gen 1978 anni
1.051
-0.063
-5.62%
1 gen 1979 anni
0.984
-0.068
-6.45%
1 gen 1980 anni
0.92
-0.063
-6.45%
1 gen 1981 anni
0.856
-0.065
-7.02%
1 gen 1982 anni
0.796
-0.06
-6.99%
1 gen 1983 anni
0.73
-0.066
-8.25%
1 gen 1984 anni
0.855
+0.125
17.06%
1 gen 1985 anni
0.935
+0.08
9.37%
1 gen 1986 anni
0.907
-0.027
-2.94%
1 gen 1987 anni
0.87
-0.037
-4.1%
1 gen 1988 anni
0.833
-0.037
-4.22%
1 gen 1989 anni
0.784
-0.049
-5.9%
1 gen 1990 anni
0.741
-0.044
-5.57%
1 gen 1991 anni
0.679
-0.061
-8.25%
1 gen 1992 anni
0.961
+0.282
41.5%
1 gen 1993 anni
1.138
+0.176
18.35%
1 gen 1994 anni
1.086
-0.052
-4.53%
1 gen 1995 anni
1.02
-0.067
-6.14%
1 gen 1996 anni
0.952
-0.068
-6.67%
1 gen 1997 anni
0.884
-0.068
-7.15%
1 gen 1998 anni
0.821
-0.063
-7.09%
1 gen 1999 anni
0.748
-0.073
-8.87%
1 gen 2000 anni
0.664
-0.085
-11.3%
1 gen 2001 anni
0.578
-0.085
-12.87%
1 gen 2002 anni
0.492
-0.086
-14.92%
1 gen 2003 anni
0.875
+0.383
77.8%
1 gen 2004 anni
1.14
+0.265
30.31%
1 gen 2005 anni
1.129
-0.011
-0.96%
1 gen 2006 anni
1.143
+0.014
1.22%
1 gen 2007 anni
1.164
+0.021
1.82%
1 gen 2008 anni
1.171
+0.007
0.64%
1 gen 2009 anni
1.172
+0.0
0.04%
1 gen 2010 anni
1.154
-0.017
-1.48%
1 gen 2011 anni
1.122
-0.032
-2.81%
1 gen 2012 anni
1.087
-0.035
-3.08%
1 gen 2013 anni
1.035
-0.052
-4.82%
1 gen 2014 anni
0.986
-0.049
-4.76%
1 gen 2015 anni
0.935
-0.05
-5.11%
1 gen 2016 anni
0.885
-0.05
-5.31%
Classificazione dei paesi secondo i statistiche attuali per anni


Commenti: