29
/it/
it
AIzaSyAYiBZKx7MnpbEhh9jyipgxe19OcubqV5w
April 1, 2024
74357
Austria
AUT
true
2
1
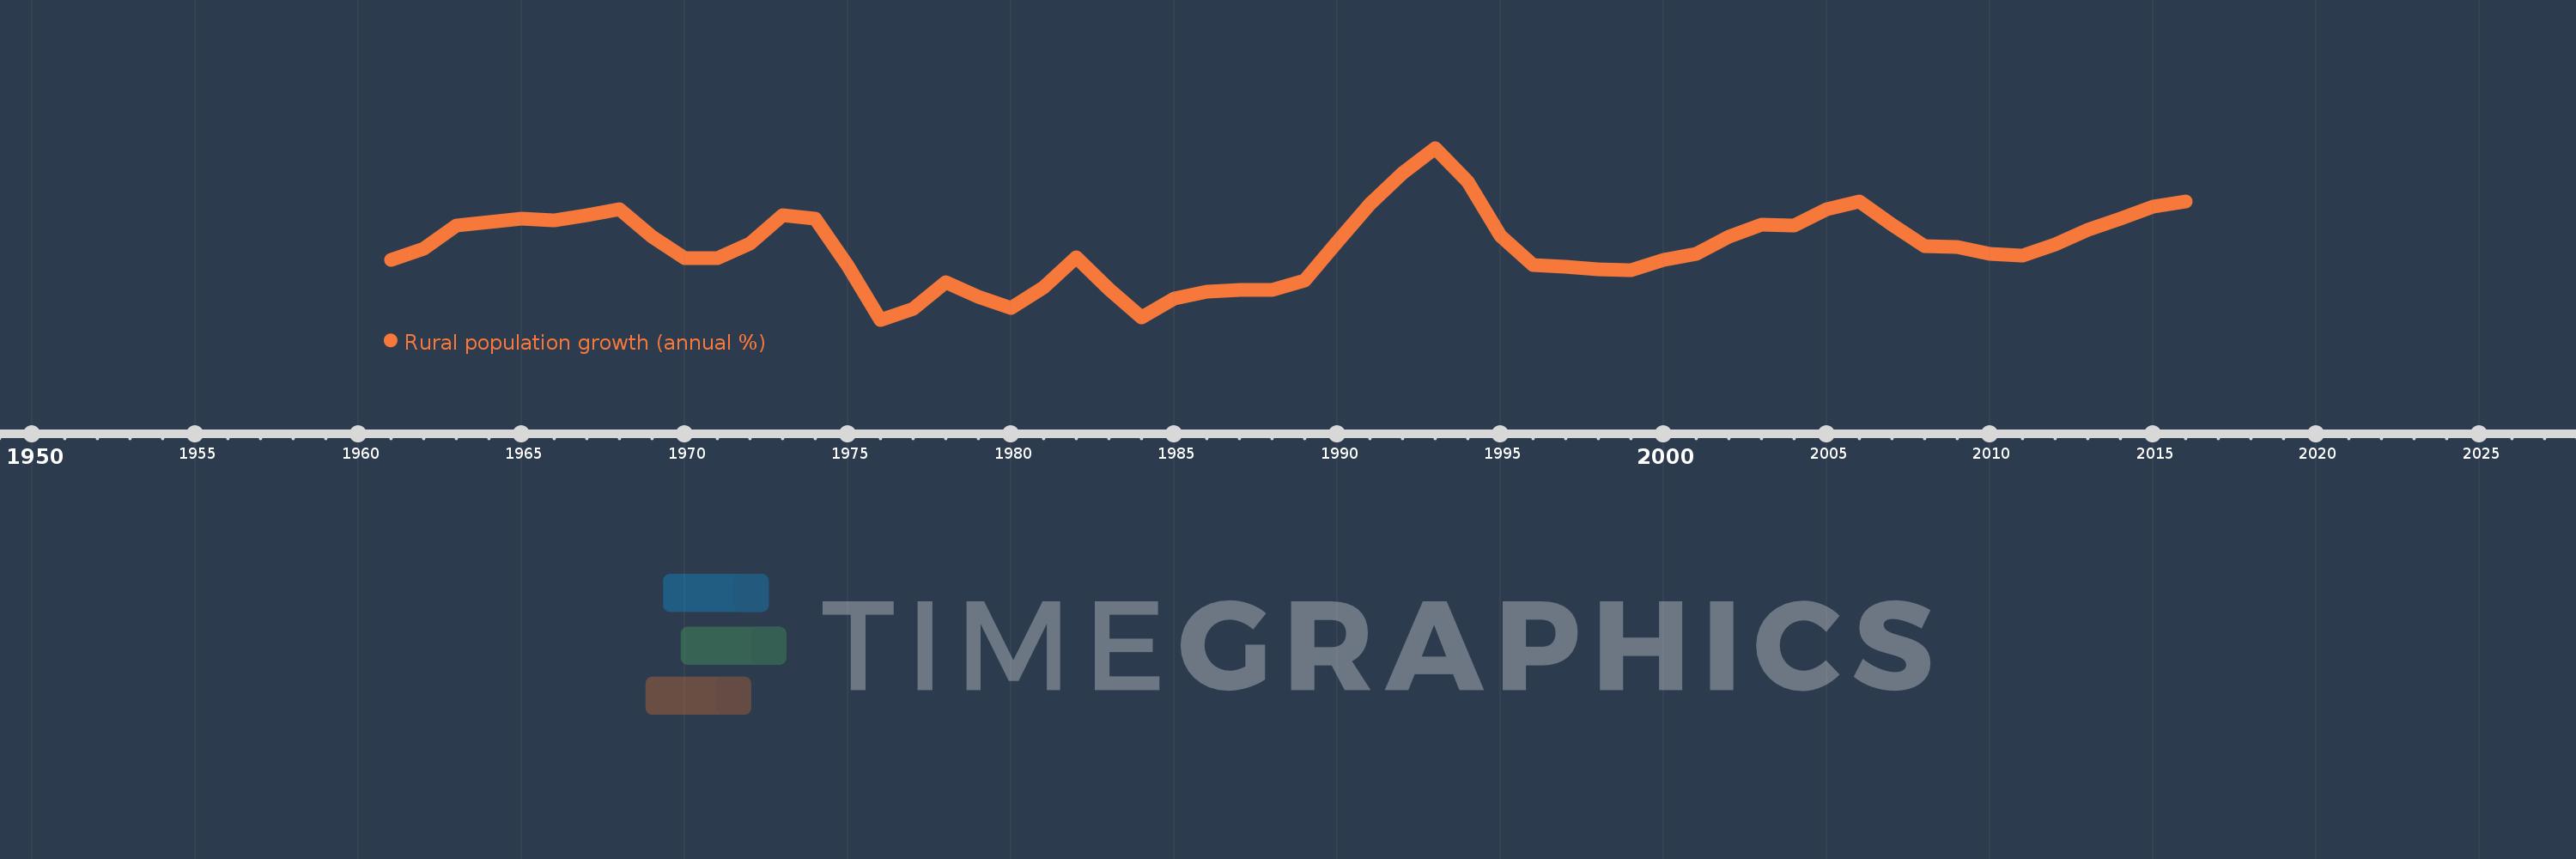
Rural population growth (annual %)
2016,2015,2014,2013,2012,2011,2010,2009,2008,2007,2006,2005,2004,2003,2002,2001,2000,1999,1998,1997,1996,1995,1994,1993,1992,1991,1990,1989,1988,1987,1986,1985,1984,1983,1982,1981,1980,1979,1978,1977,1976,1975,1974,1973,1972,1971,1970,1969,1968,1967,1966,1965,1964,1963,1962,1961
Queste statistiche in altri paesi:
AfghanistanAlbaniaAlgeriaAmerican SamoaAndorraAngolaAntigua and BarbudaArab WorldArgentinaArmeniaArubaAustraliaAustriaAzerbaijanBahamas, TheBahrainBangladeshBarbadosBelarusBelgiumBelizeBeninBhutanBoliviaBosnia and HerzegovinaBotswanaBrazilBritish Virgin IslandsBrunei DarussalamBulgariaBurkina FasoBurundiCabo VerdeCambodiaCameroonCanadaCaribbean small statesCentral African RepublicCentral Europe and the BalticsChadChannel IslandsChileChinaColombiaComorosCongo, Dem. Rep.Congo, Rep.Costa RicaCote d'IvoireCroatiaCubaCuracaoCyprusCzech RepublicDenmarkDjiboutiDominicaDominican RepublicEarly-demographic dividendEast Asia & PacificEast Asia & Pacific (excluding high income)East Asia & Pacific (IDA & IBRD countries)EcuadorEgypt, Arab Rep.El SalvadorEquatorial GuineaEritreaEstoniaEthiopiaEuro areaEurope & Central AsiaEurope & Central Asia (excluding high income)Europe & Central Asia (IDA & IBRD countries)European UnionFaroe IslandsFijiFinlandFragile and conflict affected situationsFranceFrench PolynesiaGabonGambia, TheGeorgiaGermanyGhanaGreeceGreenlandGrenadaGuamGuatemalaGuineaGuinea-BissauGuyanaHaitiHeavily indebted poor countries (HIPC)High incomeHondurasHong Kong SAR, ChinaHungaryIBRD onlyIcelandIDA & IBRD totalIDA blendIDA onlyIDA totalIndiaIndonesiaIran, Islamic Rep.IraqIrelandIsle of ManIsraelItalyJamaicaJapanJordanKazakhstanKenyaKiribatiKorea, Dem. People’s Rep.Korea, Rep.KuwaitKyrgyz RepublicLao PDRLate-demographic dividendLatin America & Caribbean Latin America & Caribbean (excluding high income)Latin America & the Caribbean (IDA & IBRD countries)LatviaLeast developed countries: UN classificationLebanonLesothoLiberiaLibyaLiechtensteinLithuaniaLow & middle incomeLow incomeLower middle incomeLuxembourgMacao SAR, ChinaMacedonia, FYRMadagascarMalawiMalaysiaMaldivesMaliMaltaMarshall IslandsMauritaniaMauritiusMexicoMicronesia, Fed. Sts.Middle East & North AfricaMiddle East & North Africa (excluding high income)Middle East & North Africa (IDA & IBRD countries)Middle incomeMoldovaMongoliaMontenegroMoroccoMozambiqueMyanmarNamibiaNauruNepalNetherlandsNew CaledoniaNew ZealandNicaraguaNigerNigeriaNorth AmericaNorthern Mariana IslandsNorwayOECD membersOmanOther small statesPacific island small statesPakistanPalauPanamaPapua New GuineaParaguayPeruPhilippinesPolandPortugalPost-demographic dividendPre-demographic dividendPuerto RicoQatarRomaniaRussian FederationRwandaSamoaSan MarinoSao Tome and PrincipeSaudi ArabiaSenegalSerbiaSeychellesSierra LeoneSlovak RepublicSloveniaSmall statesSolomon IslandsSomaliaSouth AfricaSouth AsiaSouth Asia (IDA & IBRD)South SudanSpainSri LankaSt. Kitts and NevisSt. LuciaSt. Vincent and the GrenadinesSub-Saharan Africa Sub-Saharan Africa (excluding high income)Sub-Saharan Africa (IDA & IBRD countries)SudanSurinameSwazilandSwedenSwitzerlandSyrian Arab RepublicTajikistanTanzaniaThailandTimor-LesteTogoTongaTrinidad and TobagoTunisiaTurkeyTurkmenistanTurks and Caicos IslandsTuvaluUgandaUkraineUnited Arab EmiratesUnited KingdomUnited StatesUpper middle incomeUruguayUzbekistanVanuatuVenezuela, RBVietnamVirgin Islands (U.S.)West Bank and GazaWorldYemen, Rep.ZambiaZimbabwe Linea del tempo:
Questa scala temporale mostra un grafico dal 1961 anno al 2016 anno. Austria. I dati fino ad 1960 anno non disponibili. Il numero di osservazioni attuali secondo i date: 56.
La fonte (nome):
Indicatori dello sviluppo mondiale
La fonte (organizzazione):
World Bank Staff estimates based on United Nations, World Urbanization Prospects.
Categorie:
Agriculture & Rural Development
sono stati aggiornati
23 apr 2017 anni
Indicatori delle variazioni dei valori per anni
Minima:
-0.294
1 gen 1976 anni
Massimo:
1.101
1 gen 1993 anni
Alla data di osservazione
Valore
Variazione assoluta
La variazione rispetto al valore precedente
1 gen 1961 anni
0.194
+0.194
0.0%
1 gen 1962 anni
0.282
+0.088
45.3%
1 gen 1963 anni
0.474
+0.192
68.12%
1 gen 1964 anni
0.5
+0.026
5.59%
1 gen 1965 anni
0.527
+0.027
5.36%
1 gen 1966 anni
0.51
-0.017
-3.23%
1 gen 1967 anni
0.558
+0.049
9.54%
1 gen 1968 anni
0.607
+0.049
8.71%
1 gen 1969 anni
0.379
-0.228
-37.62%
1 gen 1970 anni
0.205
-0.174
-45.98%
1 gen 1971 anni
0.205
+0.001
0.4%
1 gen 1972 anni
0.322
+0.117
56.96%
1 gen 1973 anni
0.552
+0.23
71.34%
1 gen 1974 anni
0.525
-0.027
-4.92%
1 gen 1975 anni
0.141
-0.384
-73.09%
1 gen 1976 anni
-0.294
-0.435
-308.11%
1 gen 1977 anni
-0.206
+0.089
-30.13%
1 gen 1978 anni
0.009
+0.215
-104.62%
1 gen 1979 anni
-0.11
-0.119
-1.26 Mille.%
1 gen 1980 anni
-0.199
-0.09
81.58%
1 gen 1981 anni
-0.029
+0.171
-85.57%
1 gen 1982 anni
0.215
+0.243
-845.58%
1 gen 1983 anni
-0.047
-0.261
-121.85%
1 gen 1984 anni
-0.277
-0.231
491.83%
1 gen 1985 anni
-0.122
+0.155
-55.93%
1 gen 1986 anni
-0.069
+0.053
-43.44%
1 gen 1987 anni
-0.053
+0.016
-23.82%
1 gen 1988 anni
-0.053
0.0
0.78%
1 gen 1989 anni
0.025
+0.078
-147.26%
1 gen 1990 anni
0.337
+0.312
1.24 Mille.%
1 gen 1991 anni
0.645
+0.308
91.57%
1 gen 1992 anni
0.896
+0.251
38.89%
1 gen 1993 anni
1.101
+0.204
22.81%
1 gen 1994 anni
0.825
-0.276
-25.07%
1 gen 1995 anni
0.385
-0.44
-53.33%
1 gen 1996 anni
0.153
-0.232
-60.22%
1 gen 1997 anni
0.135
-0.018
-11.81%
1 gen 1998 anni
0.113
-0.022
-16.09%
1 gen 1999 anni
0.11
-0.004
-3.15%
1 gen 2000 anni
0.195
+0.085
77.3%
1 gen 2001 anni
0.24
+0.046
23.6%
1 gen 2002 anni
0.38
+0.139
57.97%
1 gen 2003 anni
0.477
+0.097
25.66%
1 gen 2004 anni
0.47
-0.008
-1.62%
1 gen 2005 anni
0.603
+0.133
28.38%
1 gen 2006 anni
0.664
+0.061
10.1%
1 gen 2007 anni
0.48
-0.184
-27.66%
1 gen 2008 anni
0.307
-0.174
-36.15%
1 gen 2009 anni
0.295
-0.011
-3.62%
1 gen 2010 anni
0.244
-0.051
-17.3%
1 gen 2011 anni
0.226
-0.019
-7.62%
1 gen 2012 anni
0.32
+0.094
41.54%
1 gen 2013 anni
0.438
+0.119
37.19%
1 gen 2014 anni
0.526
+0.087
19.88%
1 gen 2015 anni
0.628
+0.103
19.54%
1 gen 2016 anni
0.667
+0.038
6.12%
Classificazione dei paesi secondo i statistiche attuali per anni


Commenti: