29
/it/
it
AIzaSyAYiBZKx7MnpbEhh9jyipgxe19OcubqV5w
April 1, 2024
116515
Curacao
CUW
true
2
1
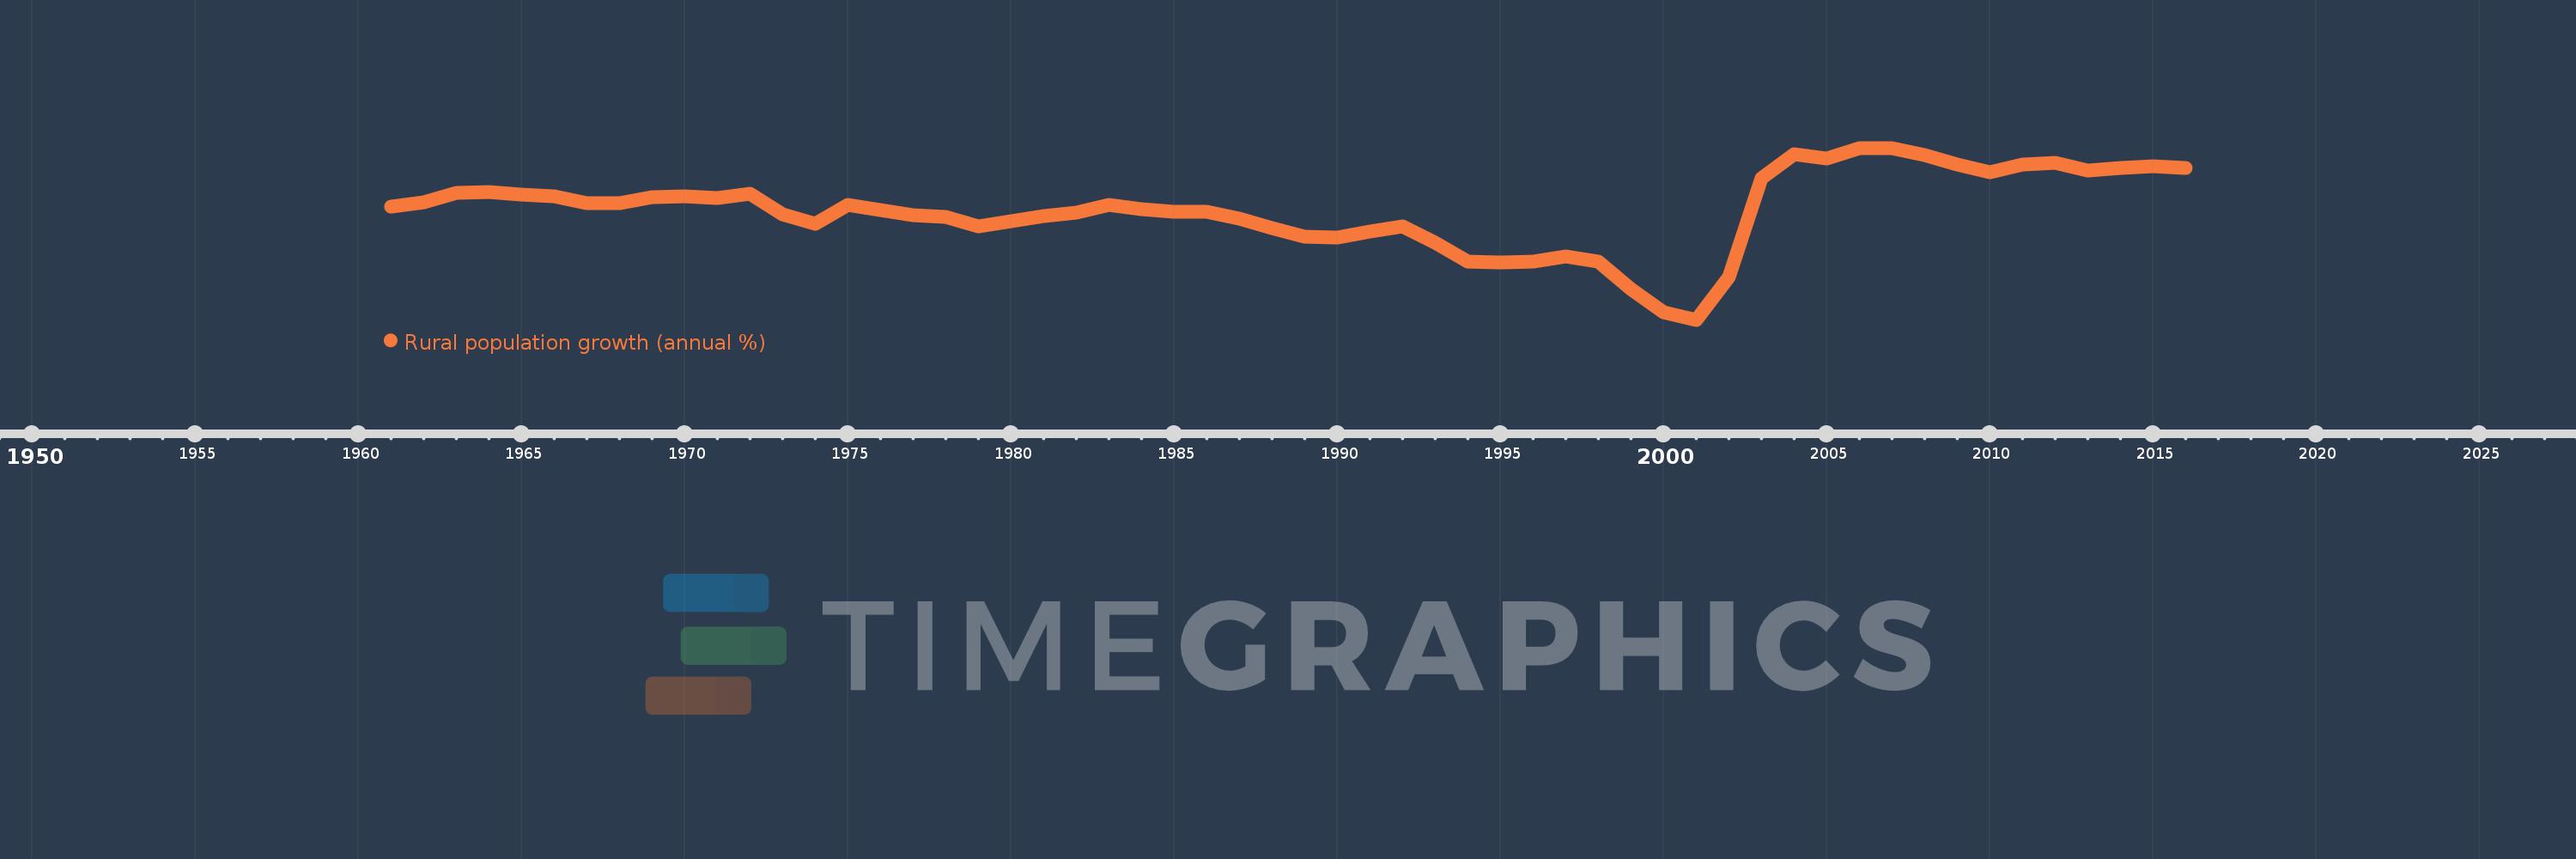
Rural population growth (annual %)
2016,2015,2014,2013,2012,2011,2010,2009,2008,2007,2006,2005,2004,2003,2002,2001,2000,1999,1998,1997,1996,1995,1994,1993,1992,1991,1990,1989,1988,1987,1986,1985,1984,1983,1982,1981,1980,1979,1978,1977,1976,1975,1974,1973,1972,1971,1970,1969,1968,1967,1966,1965,1964,1963,1962,1961
Queste statistiche in altri paesi:
AfghanistanAlbaniaAlgeriaAmerican SamoaAndorraAngolaAntigua and BarbudaArab WorldArgentinaArmeniaArubaAustraliaAustriaAzerbaijanBahamas, TheBahrainBangladeshBarbadosBelarusBelgiumBelizeBeninBhutanBoliviaBosnia and HerzegovinaBotswanaBrazilBritish Virgin IslandsBrunei DarussalamBulgariaBurkina FasoBurundiCabo VerdeCambodiaCameroonCanadaCaribbean small statesCentral African RepublicCentral Europe and the BalticsChadChannel IslandsChileChinaColombiaComorosCongo, Dem. Rep.Congo, Rep.Costa RicaCote d'IvoireCroatiaCubaCuracaoCyprusCzech RepublicDenmarkDjiboutiDominicaDominican RepublicEarly-demographic dividendEast Asia & PacificEast Asia & Pacific (excluding high income)East Asia & Pacific (IDA & IBRD countries)EcuadorEgypt, Arab Rep.El SalvadorEquatorial GuineaEritreaEstoniaEthiopiaEuro areaEurope & Central AsiaEurope & Central Asia (excluding high income)Europe & Central Asia (IDA & IBRD countries)European UnionFaroe IslandsFijiFinlandFragile and conflict affected situationsFranceFrench PolynesiaGabonGambia, TheGeorgiaGermanyGhanaGreeceGreenlandGrenadaGuamGuatemalaGuineaGuinea-BissauGuyanaHaitiHeavily indebted poor countries (HIPC)High incomeHondurasHong Kong SAR, ChinaHungaryIBRD onlyIcelandIDA & IBRD totalIDA blendIDA onlyIDA totalIndiaIndonesiaIran, Islamic Rep.IraqIrelandIsle of ManIsraelItalyJamaicaJapanJordanKazakhstanKenyaKiribatiKorea, Dem. People’s Rep.Korea, Rep.KuwaitKyrgyz RepublicLao PDRLate-demographic dividendLatin America & Caribbean Latin America & Caribbean (excluding high income)Latin America & the Caribbean (IDA & IBRD countries)LatviaLeast developed countries: UN classificationLebanonLesothoLiberiaLibyaLiechtensteinLithuaniaLow & middle incomeLow incomeLower middle incomeLuxembourgMacao SAR, ChinaMacedonia, FYRMadagascarMalawiMalaysiaMaldivesMaliMaltaMarshall IslandsMauritaniaMauritiusMexicoMicronesia, Fed. Sts.Middle East & North AfricaMiddle East & North Africa (excluding high income)Middle East & North Africa (IDA & IBRD countries)Middle incomeMoldovaMongoliaMontenegroMoroccoMozambiqueMyanmarNamibiaNauruNepalNetherlandsNew CaledoniaNew ZealandNicaraguaNigerNigeriaNorth AmericaNorthern Mariana IslandsNorwayOECD membersOmanOther small statesPacific island small statesPakistanPalauPanamaPapua New GuineaParaguayPeruPhilippinesPolandPortugalPost-demographic dividendPre-demographic dividendPuerto RicoQatarRomaniaRussian FederationRwandaSamoaSan MarinoSao Tome and PrincipeSaudi ArabiaSenegalSerbiaSeychellesSierra LeoneSlovak RepublicSloveniaSmall statesSolomon IslandsSomaliaSouth AfricaSouth AsiaSouth Asia (IDA & IBRD)South SudanSpainSri LankaSt. Kitts and NevisSt. LuciaSt. Vincent and the GrenadinesSub-Saharan Africa Sub-Saharan Africa (excluding high income)Sub-Saharan Africa (IDA & IBRD countries)SudanSurinameSwazilandSwedenSwitzerlandSyrian Arab RepublicTajikistanTanzaniaThailandTimor-LesteTogoTongaTrinidad and TobagoTunisiaTurkeyTurkmenistanTurks and Caicos IslandsTuvaluUgandaUkraineUnited Arab EmiratesUnited KingdomUnited StatesUpper middle incomeUruguayUzbekistanVanuatuVenezuela, RBVietnamVirgin Islands (U.S.)West Bank and GazaWorldYemen, Rep.ZambiaZimbabwe Linea del tempo:
Questa scala temporale mostra un grafico dal 1961 anno al 2016 anno. Curacao. I dati fino ad 1960 anno non disponibili. Il numero di osservazioni attuali secondo i date: 56.
La fonte (nome):
Indicatori dello sviluppo mondiale
La fonte (organizzazione):
World Bank Staff estimates based on United Nations, World Urbanization Prospects.
Categorie:
Agriculture & Rural Development
sono stati aggiornati
23 apr 2017 anni
Indicatori delle variazioni dei valori per anni
Minima:
-9.898
1 gen 2001 anni
Massimo:
3.854
1 gen 2007 anni
Alla data di osservazione
Valore
Variazione assoluta
La variazione rispetto al valore precedente
1 gen 1961 anni
-0.823
-0.823
0.0%
1 gen 1962 anni
-0.524
+0.299
-36.35%
1 gen 1963 anni
0.226
+0.75
-143.09%
1 gen 1964 anni
0.305
+0.079
34.85%
1 gen 1965 anni
0.146
-0.159
-52.19%
1 gen 1966 anni
-0.019
-0.165
-113.04%
1 gen 1967 anni
-0.562
-0.543
2.86 Mille.%
1 gen 1968 anni
-0.549
+0.013
-2.28%
1 gen 1969 anni
-0.07
+0.478
-87.17%
1 gen 1970 anni
-0.013
+0.058
-81.81%
1 gen 1971 anni
-0.131
-0.119
925.74%
1 gen 1972 anni
0.173
+0.304
-231.68%
1 gen 1973 anni
-1.434
-1.607
-929.28%
1 gen 1974 anni
-2.192
-0.758
52.86%
1 gen 1975 anni
-0.693
+1.5
-68.41%
1 gen 1976 anni
-1.146
-0.453
65.46%
1 gen 1977 anni
-1.498
-0.352
30.75%
1 gen 1978 anni
-1.643
-0.145
9.66%
1 gen 1979 anni
-2.44
-0.796
48.47%
1 gen 1980 anni
-2.033
+0.407
-16.68%
1 gen 1981 anni
-1.573
+0.459
-22.6%
1 gen 1982 anni
-1.313
+0.261
-16.56%
1 gen 1983 anni
-0.731
+0.582
-44.32%
1 gen 1984 anni
-1.019
-0.288
39.36%
1 gen 1985 anni
-1.222
-0.204
19.99%
1 gen 1986 anni
-1.226
-0.003
0.28%
1 gen 1987 anni
-1.774
-0.548
44.69%
1 gen 1988 anni
-2.543
-0.769
43.37%
1 gen 1989 anni
-3.219
-0.677
26.61%
1 gen 1990 anni
-3.318
-0.098
3.06%
1 gen 1991 anni
-2.819
+0.498
-15.02%
1 gen 1992 anni
-2.458
+0.361
-12.8%
1 gen 1993 anni
-3.697
-1.239
50.39%
1 gen 1994 anni
-5.238
-1.541
41.67%
1 gen 1995 anni
-5.331
-0.093
1.78%
1 gen 1996 anni
-5.262
+0.07
-1.3%
1 gen 1997 anni
-4.859
+0.403
-7.66%
1 gen 1998 anni
-5.249
-0.39
8.03%
1 gen 1999 anni
-7.441
-2.192
41.77%
1 gen 2000 anni
-9.327
-1.885
25.34%
1 gen 2001 anni
-9.898
-0.572
6.13%
1 gen 2002 anni
-6.5
+3.399
-34.34%
1 gen 2003 anni
1.412
+7.912
-121.73%
1 gen 2004 anni
3.36
+1.947
137.88%
1 gen 2005 anni
3.02
-0.34
-10.13%
1 gen 2006 anni
3.841
+0.821
27.19%
1 gen 2007 anni
3.854
+0.013
0.34%
1 gen 2008 anni
3.262
-0.592
-15.37%
1 gen 2009 anni
2.547
-0.714
-21.9%
1 gen 2010 anni
1.932
-0.615
-24.15%
1 gen 2011 anni
2.557
+0.625
32.35%
1 gen 2012 anni
2.695
+0.137
5.38%
1 gen 2013 anni
2.028
-0.666
-24.72%
1 gen 2014 anni
2.237
+0.209
10.28%
1 gen 2015 anni
2.37
+0.133
5.96%
1 gen 2016 anni
2.286
-0.085
-3.57%
Classificazione dei paesi secondo i statistiche attuali per anni


Commenti: