29
/it/
it
AIzaSyAYiBZKx7MnpbEhh9jyipgxe19OcubqV5w
April 1, 2024
251357
St. Lucia
LCA
true
2
1
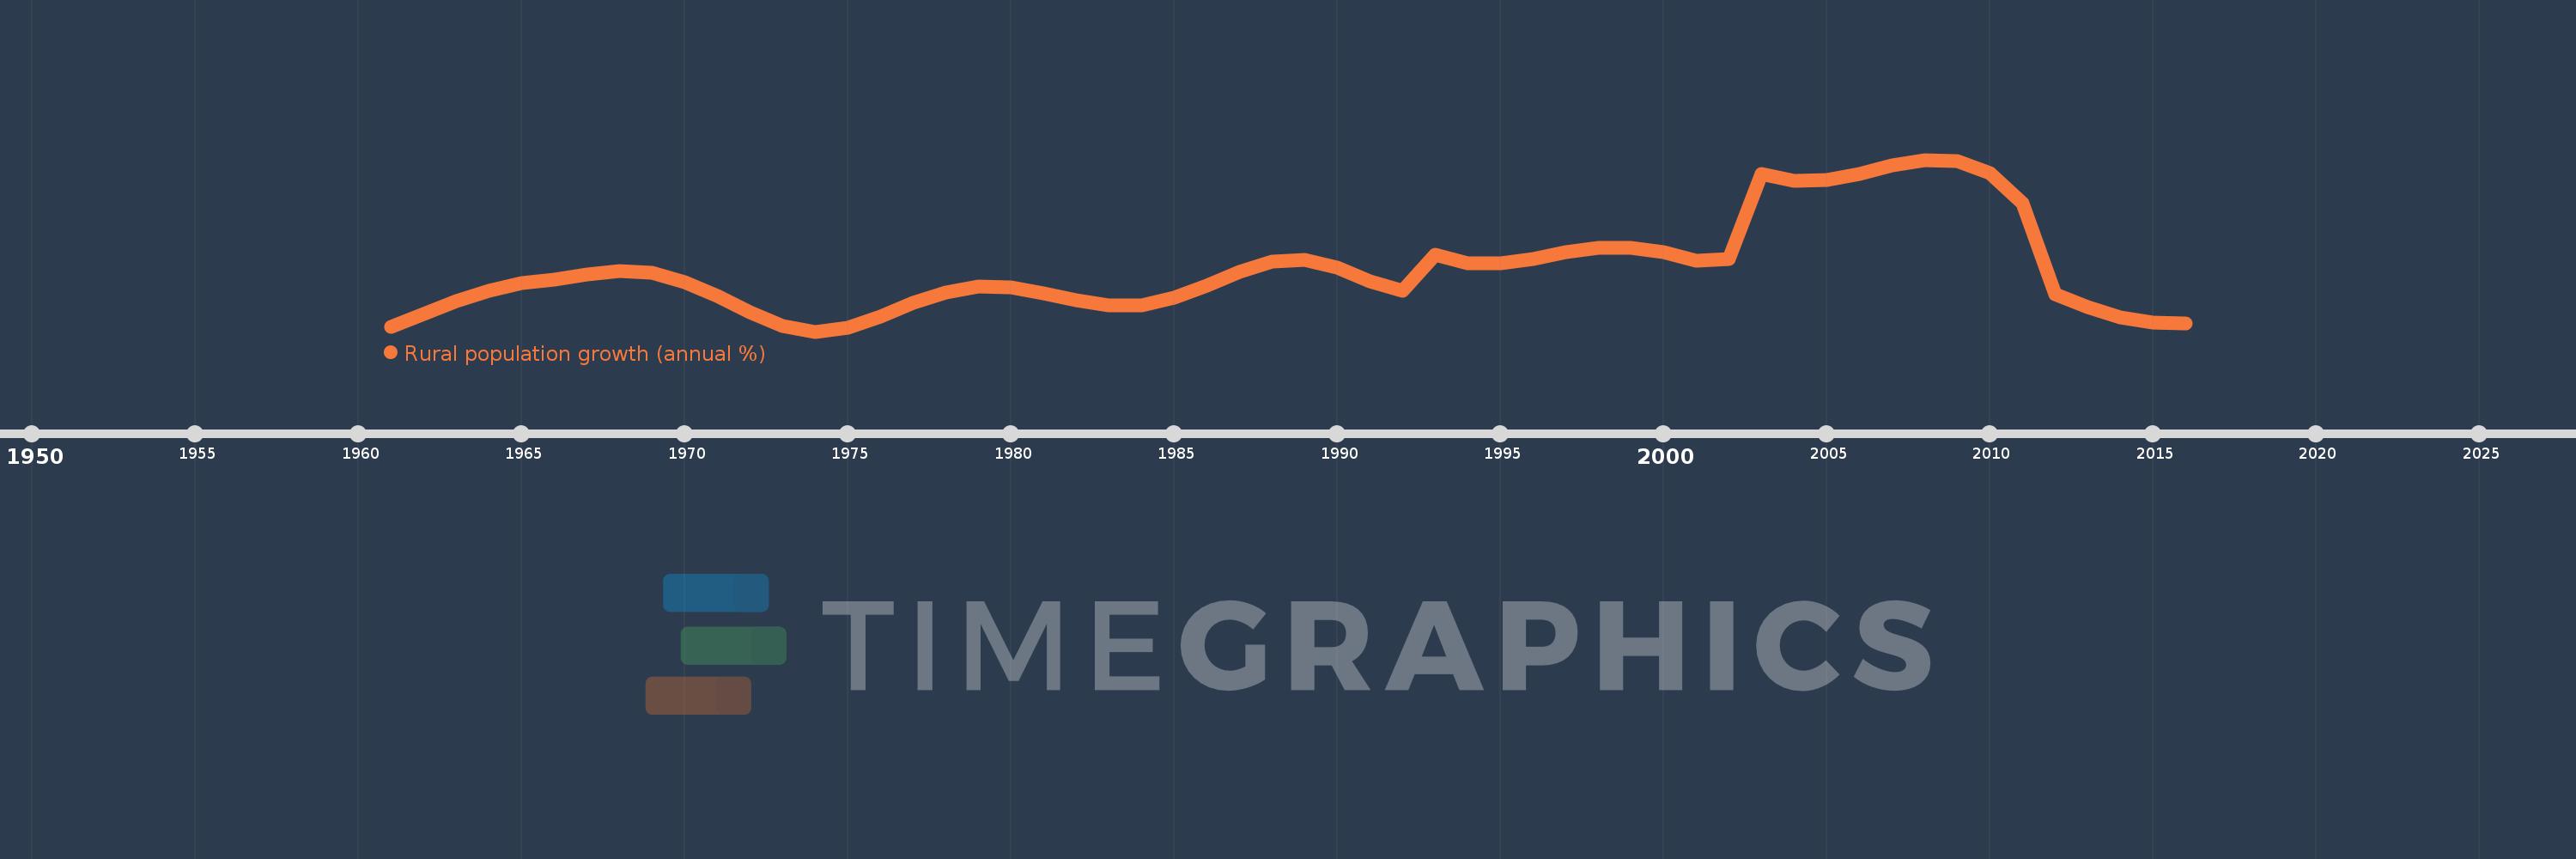
Rural population growth (annual %)
2016,2015,2014,2013,2012,2011,2010,2009,2008,2007,2006,2005,2004,2003,2002,2001,2000,1999,1998,1997,1996,1995,1994,1993,1992,1991,1990,1989,1988,1987,1986,1985,1984,1983,1982,1981,1980,1979,1978,1977,1976,1975,1974,1973,1972,1971,1970,1969,1968,1967,1966,1965,1964,1963,1962,1961
Queste statistiche in altri paesi:
AfghanistanAlbaniaAlgeriaAmerican SamoaAndorraAngolaAntigua and BarbudaArab WorldArgentinaArmeniaArubaAustraliaAustriaAzerbaijanBahamas, TheBahrainBangladeshBarbadosBelarusBelgiumBelizeBeninBhutanBoliviaBosnia and HerzegovinaBotswanaBrazilBritish Virgin IslandsBrunei DarussalamBulgariaBurkina FasoBurundiCabo VerdeCambodiaCameroonCanadaCaribbean small statesCentral African RepublicCentral Europe and the BalticsChadChannel IslandsChileChinaColombiaComorosCongo, Dem. Rep.Congo, Rep.Costa RicaCote d'IvoireCroatiaCubaCuracaoCyprusCzech RepublicDenmarkDjiboutiDominicaDominican RepublicEarly-demographic dividendEast Asia & PacificEast Asia & Pacific (excluding high income)East Asia & Pacific (IDA & IBRD countries)EcuadorEgypt, Arab Rep.El SalvadorEquatorial GuineaEritreaEstoniaEthiopiaEuro areaEurope & Central AsiaEurope & Central Asia (excluding high income)Europe & Central Asia (IDA & IBRD countries)European UnionFaroe IslandsFijiFinlandFragile and conflict affected situationsFranceFrench PolynesiaGabonGambia, TheGeorgiaGermanyGhanaGreeceGreenlandGrenadaGuamGuatemalaGuineaGuinea-BissauGuyanaHaitiHeavily indebted poor countries (HIPC)High incomeHondurasHong Kong SAR, ChinaHungaryIBRD onlyIcelandIDA & IBRD totalIDA blendIDA onlyIDA totalIndiaIndonesiaIran, Islamic Rep.IraqIrelandIsle of ManIsraelItalyJamaicaJapanJordanKazakhstanKenyaKiribatiKorea, Dem. People’s Rep.Korea, Rep.KuwaitKyrgyz RepublicLao PDRLate-demographic dividendLatin America & Caribbean Latin America & Caribbean (excluding high income)Latin America & the Caribbean (IDA & IBRD countries)LatviaLeast developed countries: UN classificationLebanonLesothoLiberiaLibyaLiechtensteinLithuaniaLow & middle incomeLow incomeLower middle incomeLuxembourgMacao SAR, ChinaMacedonia, FYRMadagascarMalawiMalaysiaMaldivesMaliMaltaMarshall IslandsMauritaniaMauritiusMexicoMicronesia, Fed. Sts.Middle East & North AfricaMiddle East & North Africa (excluding high income)Middle East & North Africa (IDA & IBRD countries)Middle incomeMoldovaMongoliaMontenegroMoroccoMozambiqueMyanmarNamibiaNauruNepalNetherlandsNew CaledoniaNew ZealandNicaraguaNigerNigeriaNorth AmericaNorthern Mariana IslandsNorwayOECD membersOmanOther small statesPacific island small statesPakistanPalauPanamaPapua New GuineaParaguayPeruPhilippinesPolandPortugalPost-demographic dividendPre-demographic dividendPuerto RicoQatarRomaniaRussian FederationRwandaSamoaSan MarinoSao Tome and PrincipeSaudi ArabiaSenegalSerbiaSeychellesSierra LeoneSlovak RepublicSloveniaSmall statesSolomon IslandsSomaliaSouth AfricaSouth AsiaSouth Asia (IDA & IBRD)South SudanSpainSri LankaSt. Kitts and NevisSt. LuciaSt. Vincent and the GrenadinesSub-Saharan Africa Sub-Saharan Africa (excluding high income)Sub-Saharan Africa (IDA & IBRD countries)SudanSurinameSwazilandSwedenSwitzerlandSyrian Arab RepublicTajikistanTanzaniaThailandTimor-LesteTogoTongaTrinidad and TobagoTunisiaTurkeyTurkmenistanTurks and Caicos IslandsTuvaluUgandaUkraineUnited Arab EmiratesUnited KingdomUnited StatesUpper middle incomeUruguayUzbekistanVanuatuVenezuela, RBVietnamVirgin Islands (U.S.)West Bank and GazaWorldYemen, Rep.ZambiaZimbabwe Linea del tempo:
Questa scala temporale mostra un grafico dal 1961 anno al 2016 anno. St. Lucia. I dati fino ad 1960 anno non disponibili. Il numero di osservazioni attuali secondo i date: 56.
La fonte (nome):
Indicatori dello sviluppo mondiale
La fonte (organizzazione):
World Bank Staff estimates based on United Nations, World Urbanization Prospects.
Categorie:
Agriculture & Rural Development
sono stati aggiornati
23 apr 2017 anni
Indicatori delle variazioni dei valori per anni
Minima:
0.596
1 gen 1974 anni
Massimo:
2.728
1 gen 2008 anni
Alla data di osservazione
Valore
Variazione assoluta
La variazione rispetto al valore precedente
1 gen 1961 anni
0.655
+0.655
0.0%
1 gen 1962 anni
0.819
+0.164
25.1%
1 gen 1963 anni
0.977
+0.158
19.23%
1 gen 1964 anni
1.105
+0.128
13.12%
1 gen 1965 anni
1.194
+0.089
8.01%
1 gen 1966 anni
1.244
+0.05
4.22%
1 gen 1967 anni
1.303
+0.059
4.74%
1 gen 1968 anni
1.349
+0.046
3.53%
1 gen 1969 anni
1.324
-0.026
-1.91%
1 gen 1970 anni
1.207
-0.117
-8.82%
1 gen 1971 anni
1.036
-0.171
-14.15%
1 gen 1972 anni
0.836
-0.201
-19.36%
1 gen 1973 anni
0.67
-0.166
-19.85%
1 gen 1974 anni
0.596
-0.074
-10.99%
1 gen 1975 anni
0.647
+0.05
8.47%
1 gen 1976 anni
0.783
+0.136
21.04%
1 gen 1977 anni
0.949
+0.167
21.29%
1 gen 1978 anni
1.086
+0.137
14.41%
1 gen 1979 anni
1.156
+0.07
6.42%
1 gen 1980 anni
1.142
-0.013
-1.14%
1 gen 1981 anni
1.075
-0.067
-5.87%
1 gen 1982 anni
0.984
-0.091
-8.5%
1 gen 1983 anni
0.917
-0.067
-6.84%
1 gen 1984 anni
0.922
+0.005
0.56%
1 gen 1985 anni
1.014
+0.093
10.05%
1 gen 1986 anni
1.166
+0.151
14.91%
1 gen 1987 anni
1.337
+0.171
14.65%
1 gen 1988 anni
1.463
+0.127
9.47%
1 gen 1989 anni
1.489
+0.026
1.79%
1 gen 1990 anni
1.393
-0.096
-6.48%
1 gen 1991 anni
1.218
-0.175
-12.54%
1 gen 1992 anni
1.105
-0.113
-9.27%
1 gen 1993 anni
1.546
+0.441
39.88%
1 gen 1994 anni
1.448
-0.098
-6.35%
1 gen 1995 anni
1.441
-0.007
-0.49%
1 gen 1996 anni
1.498
+0.057
3.95%
1 gen 1997 anni
1.579
+0.081
5.43%
1 gen 1998 anni
1.633
+0.054
3.42%
1 gen 1999 anni
1.639
+0.006
0.34%
1 gen 2000 anni
1.577
-0.061
-3.74%
1 gen 2001 anni
1.475
-0.102
-6.47%
1 gen 2002 anni
1.494
+0.019
1.26%
1 gen 2003 anni
2.548
+1.055
70.61%
1 gen 2004 anni
2.462
-0.086
-3.39%
1 gen 2005 anni
2.48
+0.018
0.74%
1 gen 2006 anni
2.555
+0.074
3.0%
1 gen 2007 anni
2.664
+0.109
4.29%
1 gen 2008 anni
2.728
+0.064
2.41%
1 gen 2009 anni
2.707
-0.021
-0.77%
1 gen 2010 anni
2.561
-0.146
-5.4%
1 gen 2011 anni
2.188
-0.373
-14.57%
1 gen 2012 anni
1.055
-1.133
-51.79%
1 gen 2013 anni
0.895
-0.159
-15.11%
1 gen 2014 anni
0.768
-0.128
-14.25%
1 gen 2015 anni
0.711
-0.057
-7.46%
1 gen 2016 anni
0.702
-0.009
-1.27%
Classificazione dei paesi secondo i statistiche attuali per anni


Commenti: