29
/it/
it
AIzaSyAYiBZKx7MnpbEhh9jyipgxe19OcubqV5w
April 1, 2024
66500
Algeria
DZA
true
2
1
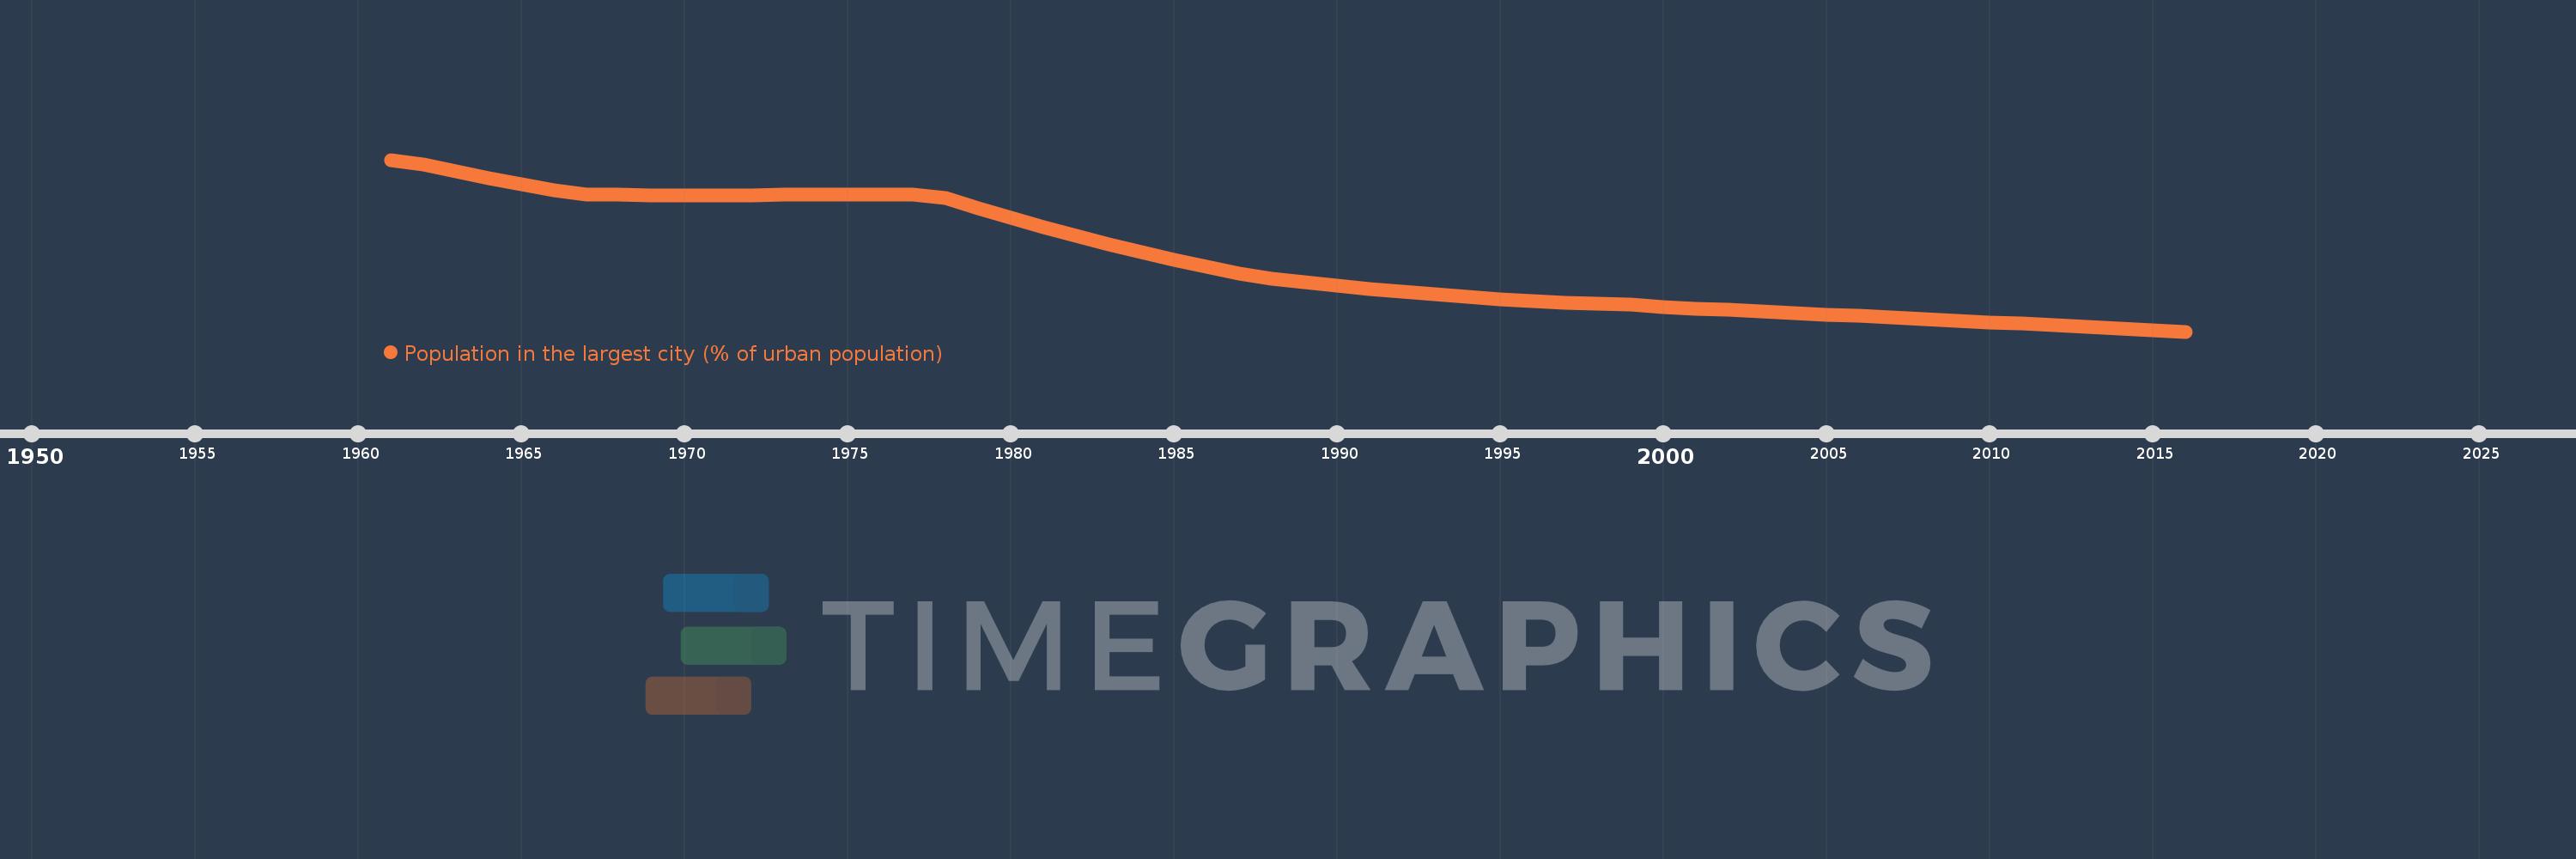
Population in the largest city (% of urban population)
2016,2015,2014,2013,2012,2011,2010,2009,2008,2007,2006,2005,2004,2003,2002,2001,2000,1999,1998,1997,1996,1995,1994,1993,1992,1991,1990,1989,1988,1987,1986,1985,1984,1983,1982,1981,1980,1979,1978,1977,1976,1975,1974,1973,1972,1971,1970,1969,1968,1967,1966,1965,1964,1963,1962,1961
Queste statistiche in altri paesi:
AfghanistanAlbaniaAlgeriaAngolaArab WorldArgentinaArmeniaAustraliaAustriaAzerbaijanBahrainBangladeshBelarusBelgiumBeninBoliviaBosnia and HerzegovinaBrazilBulgariaBurkina FasoBurundiCambodiaCameroonCanadaCentral African RepublicCentral Europe and the BalticsChadChileChinaColombiaCongo, Dem. Rep.Congo, Rep.Costa RicaCote d'IvoireCroatiaCubaCzech RepublicDenmarkDjiboutiDominican RepublicEarly-demographic dividendEast Asia & PacificEast Asia & Pacific (excluding high income)East Asia & Pacific (IDA & IBRD countries)EcuadorEgypt, Arab Rep.El SalvadorEritreaEstoniaEthiopiaEuro areaEurope & Central AsiaEurope & Central Asia (excluding high income)Europe & Central Asia (IDA & IBRD countries)European UnionFinlandFragile and conflict affected situationsFranceGabonGambia, TheGeorgiaGermanyGhanaGreeceGuatemalaGuineaGuinea-BissauHaitiHeavily indebted poor countries (HIPC)High incomeHondurasHong Kong SAR, ChinaHungaryIBRD onlyIDA & IBRD totalIDA blendIDA onlyIDA totalIndiaIndonesiaIran, Islamic Rep.IraqIrelandIsraelItalyJamaicaJapanJordanKazakhstanKenyaKorea, Dem. People’s Rep.Korea, Rep.KuwaitKyrgyz RepublicLao PDRLate-demographic dividendLatin America & Caribbean Latin America & Caribbean (excluding high income)Latin America & the Caribbean (IDA & IBRD countries)LatviaLeast developed countries: UN classificationLebanonLiberiaLibyaLithuaniaLow & middle incomeLow incomeLower middle incomeMacao SAR, ChinaMacedonia, FYRMadagascarMalawiMalaysiaMaliMauritaniaMexicoMiddle East & North AfricaMiddle East & North Africa (excluding high income)Middle East & North Africa (IDA & IBRD countries)Middle incomeMoldovaMongoliaMoroccoMozambiqueMyanmarNamibiaNepalNetherlandsNew ZealandNicaraguaNigerNigeriaNorth AmericaNorwayOECD membersOmanPakistanPanamaPapua New GuineaParaguayPeruPhilippinesPolandPortugalPost-demographic dividendPre-demographic dividendPuerto RicoQatarRomaniaRussian FederationRwandaSaudi ArabiaSenegalSerbiaSierra LeoneSingaporeSlovak RepublicSomaliaSouth AfricaSouth AsiaSouth Asia (IDA & IBRD)South SudanSpainSri LankaSub-Saharan Africa Sub-Saharan Africa (excluding high income)Sub-Saharan Africa (IDA & IBRD countries)SudanSwedenSwitzerlandSyrian Arab RepublicTajikistanTanzaniaThailandTogoTunisiaTurkeyTurkmenistanUgandaUkraineUnited Arab EmiratesUnited KingdomUnited StatesUpper middle incomeUruguayUzbekistanVenezuela, RBVietnamWest Bank and GazaWorldYemen, Rep.ZambiaZimbabwe Linea del tempo:
Questa scala temporale mostra un grafico dal 1961 anno al 2016 anno. Algeria. I dati fino ad 1960 anno non disponibili. Il numero di osservazioni attuali secondo i date: 56.
La fonte (nome):
Indicatori dello sviluppo mondiale
La fonte (organizzazione):
United Nations, World Urbanization Prospects.
Categorie:
Urban Development
sono stati aggiornati
23 apr 2017 anni
Indicatori delle variazioni dei valori per anni
Minima:
9.247
1 gen 2016 anni
Massimo:
25.68
1 gen 1961 anni
Alla data di osservazione
Valore
Variazione assoluta
La variazione rispetto al valore precedente
1 gen 1961 anni
25.68
+25.68
0.0%
1 gen 1962 anni
25.199
-0.481
-1.87%
1 gen 1963 anni
24.547
-0.652
-2.59%
1 gen 1964 anni
23.929
-0.618
-2.52%
1 gen 1965 anni
23.333
-0.596
-2.49%
1 gen 1966 anni
22.751
-0.582
-2.49%
1 gen 1967 anni
22.32
-0.431
-1.9%
1 gen 1968 anni
22.316
-0.004
-0.02%
1 gen 1969 anni
22.304
-0.012
-0.05%
1 gen 1970 anni
22.292
-0.011
-0.05%
1 gen 1971 anni
22.291
-0.001
-0.01%
1 gen 1972 anni
22.302
+0.01
0.05%
1 gen 1973 anni
22.32
+0.018
0.08%
1 gen 1974 anni
22.338
+0.018
0.08%
1 gen 1975 anni
22.353
+0.015
0.07%
1 gen 1976 anni
22.358
+0.005
0.02%
1 gen 1977 anni
22.357
-0.001
0.0%
1 gen 1978 anni
21.983
-0.374
-1.67%
1 gen 1979 anni
21.04
-0.943
-4.29%
1 gen 1980 anni
20.132
-0.908
-4.32%
1 gen 1981 anni
19.257
-0.875
-4.35%
1 gen 1982 anni
18.416
-0.841
-4.37%
1 gen 1983 anni
17.611
-0.805
-4.37%
1 gen 1984 anni
16.846
-0.765
-4.34%
1 gen 1985 anni
16.125
-0.721
-4.28%
1 gen 1986 anni
15.45
-0.675
-4.19%
1 gen 1987 anni
14.818
-0.631
-4.09%
1 gen 1988 anni
14.287
-0.531
-3.58%
1 gen 1989 anni
13.937
-0.35
-2.45%
1 gen 1990 anni
13.613
-0.324
-2.33%
1 gen 1991 anni
13.315
-0.298
-2.19%
1 gen 1992 anni
13.041
-0.274
-2.06%
1 gen 1993 anni
12.791
-0.25
-1.92%
1 gen 1994 anni
12.565
-0.226
-1.77%
1 gen 1995 anni
12.365
-0.2
-1.59%
1 gen 1996 anni
12.19
-0.175
-1.41%
1 gen 1997 anni
12.039
-0.151
-1.24%
1 gen 1998 anni
11.909
-0.13
-1.08%
1 gen 1999 anni
11.795
-0.114
-0.95%
1 gen 2000 anni
11.619
-0.176
-1.49%
1 gen 2001 anni
11.456
-0.163
-1.4%
1 gen 2002 anni
11.304
-0.152
-1.33%
1 gen 2003 anni
11.161
-0.143
-1.26%
1 gen 2004 anni
11.023
-0.138
-1.24%
1 gen 2005 anni
10.885
-0.138
-1.25%
1 gen 2006 anni
10.745
-0.141
-1.29%
1 gen 2007 anni
10.601
-0.144
-1.34%
1 gen 2008 anni
10.454
-0.147
-1.38%
1 gen 2009 anni
10.304
-0.151
-1.44%
1 gen 2010 anni
10.15
-0.153
-1.49%
1 gen 2011 anni
9.994
-0.156
-1.54%
1 gen 2012 anni
9.836
-0.159
-1.59%
1 gen 2013 anni
9.676
-0.16
-1.62%
1 gen 2014 anni
9.52
-0.156
-1.61%
1 gen 2015 anni
9.374
-0.146
-1.54%
1 gen 2016 anni
9.247
-0.127
-1.36%
Classificazione dei paesi secondo i statistiche attuali per anni


Commenti: