29
/it/
it
AIzaSyAYiBZKx7MnpbEhh9jyipgxe19OcubqV5w
April 1, 2024
161865
Italy
ITA
true
2
1
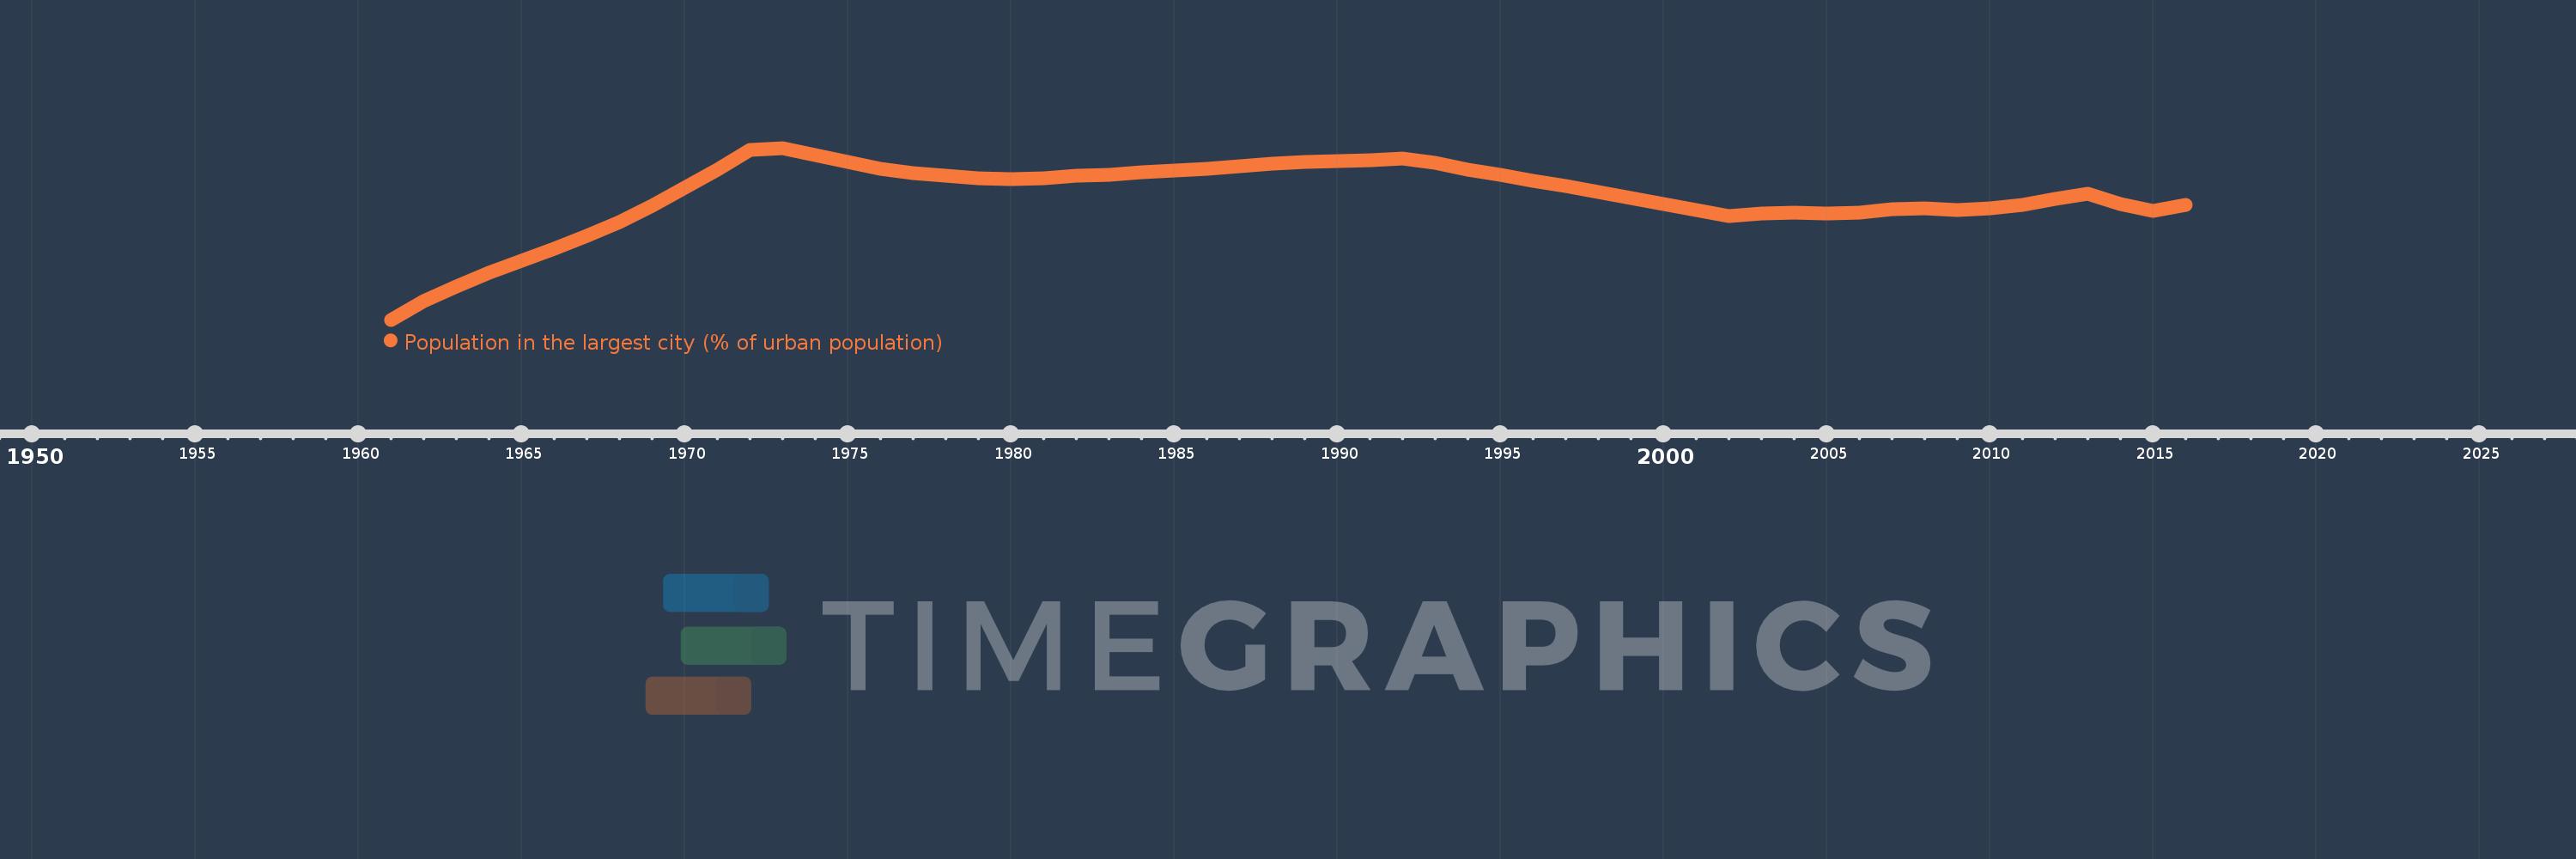
Population in the largest city (% of urban population)
2016,2015,2014,2013,2012,2011,2010,2009,2008,2007,2006,2005,2004,2003,2002,2001,2000,1999,1998,1997,1996,1995,1994,1993,1992,1991,1990,1989,1988,1987,1986,1985,1984,1983,1982,1981,1980,1979,1978,1977,1976,1975,1974,1973,1972,1971,1970,1969,1968,1967,1966,1965,1964,1963,1962,1961
Queste statistiche in altri paesi:
AfghanistanAlbaniaAlgeriaAngolaArab WorldArgentinaArmeniaAustraliaAustriaAzerbaijanBahrainBangladeshBelarusBelgiumBeninBoliviaBosnia and HerzegovinaBrazilBulgariaBurkina FasoBurundiCambodiaCameroonCanadaCentral African RepublicCentral Europe and the BalticsChadChileChinaColombiaCongo, Dem. Rep.Congo, Rep.Costa RicaCote d'IvoireCroatiaCubaCzech RepublicDenmarkDjiboutiDominican RepublicEarly-demographic dividendEast Asia & PacificEast Asia & Pacific (excluding high income)East Asia & Pacific (IDA & IBRD countries)EcuadorEgypt, Arab Rep.El SalvadorEritreaEstoniaEthiopiaEuro areaEurope & Central AsiaEurope & Central Asia (excluding high income)Europe & Central Asia (IDA & IBRD countries)European UnionFinlandFragile and conflict affected situationsFranceGabonGambia, TheGeorgiaGermanyGhanaGreeceGuatemalaGuineaGuinea-BissauHaitiHeavily indebted poor countries (HIPC)High incomeHondurasHong Kong SAR, ChinaHungaryIBRD onlyIDA & IBRD totalIDA blendIDA onlyIDA totalIndiaIndonesiaIran, Islamic Rep.IraqIrelandIsraelItalyJamaicaJapanJordanKazakhstanKenyaKorea, Dem. People’s Rep.Korea, Rep.KuwaitKyrgyz RepublicLao PDRLate-demographic dividendLatin America & Caribbean Latin America & Caribbean (excluding high income)Latin America & the Caribbean (IDA & IBRD countries)LatviaLeast developed countries: UN classificationLebanonLiberiaLibyaLithuaniaLow & middle incomeLow incomeLower middle incomeMacao SAR, ChinaMacedonia, FYRMadagascarMalawiMalaysiaMaliMauritaniaMexicoMiddle East & North AfricaMiddle East & North Africa (excluding high income)Middle East & North Africa (IDA & IBRD countries)Middle incomeMoldovaMongoliaMoroccoMozambiqueMyanmarNamibiaNepalNetherlandsNew ZealandNicaraguaNigerNigeriaNorth AmericaNorwayOECD membersOmanPakistanPanamaPapua New GuineaParaguayPeruPhilippinesPolandPortugalPost-demographic dividendPre-demographic dividendPuerto RicoQatarRomaniaRussian FederationRwandaSaudi ArabiaSenegalSerbiaSierra LeoneSingaporeSlovak RepublicSomaliaSouth AfricaSouth AsiaSouth Asia (IDA & IBRD)South SudanSpainSri LankaSub-Saharan Africa Sub-Saharan Africa (excluding high income)Sub-Saharan Africa (IDA & IBRD countries)SudanSwedenSwitzerlandSyrian Arab RepublicTajikistanTanzaniaThailandTogoTunisiaTurkeyTurkmenistanUgandaUkraineUnited Arab EmiratesUnited KingdomUnited StatesUpper middle incomeUruguayUzbekistanVenezuela, RBVietnamWest Bank and GazaWorldYemen, Rep.ZambiaZimbabwe Linea del tempo:
Questa scala temporale mostra un grafico dal 1961 anno al 2016 anno. Italy. I dati fino ad 1960 anno non disponibili. Il numero di osservazioni attuali secondo i date: 56.
La fonte (nome):
Indicatori dello sviluppo mondiale
La fonte (organizzazione):
United Nations, World Urbanization Prospects.
Categorie:
Urban Development
sono stati aggiornati
23 apr 2017 anni
Indicatori delle variazioni dei valori per anni
Minima:
8.24
1 gen 1961 anni
Massimo:
9.181
1 gen 1973 anni
Alla data di osservazione
Valore
Variazione assoluta
La variazione rispetto al valore precedente
1 gen 1961 anni
8.24
+8.24
0.0%
1 gen 1962 anni
8.342
+0.101
1.23%
1 gen 1963 anni
8.424
+0.083
0.99%
1 gen 1964 anni
8.496
+0.072
0.85%
1 gen 1965 anni
8.562
+0.066
0.77%
1 gen 1966 anni
8.627
+0.065
0.76%
1 gen 1967 anni
8.699
+0.072
0.84%
1 gen 1968 anni
8.777
+0.078
0.9%
1 gen 1969 anni
8.866
+0.088
1.01%
1 gen 1970 anni
8.961
+0.096
1.08%
1 gen 1971 anni
9.062
+0.101
1.13%
1 gen 1972 anni
9.171
+0.109
1.2%
1 gen 1973 anni
9.181
+0.01
0.11%
1 gen 1974 anni
9.14
-0.041
-0.45%
1 gen 1975 anni
9.102
-0.039
-0.42%
1 gen 1976 anni
9.068
-0.033
-0.36%
1 gen 1977 anni
9.044
-0.024
-0.26%
1 gen 1978 anni
9.027
-0.017
-0.19%
1 gen 1979 anni
9.017
-0.011
-0.12%
1 gen 1980 anni
9.012
-0.005
-0.05%
1 gen 1981 anni
9.015
+0.003
0.04%
1 gen 1982 anni
9.027
+0.011
0.12%
1 gen 1983 anni
9.036
+0.009
0.1%
1 gen 1984 anni
9.046
+0.01
0.11%
1 gen 1985 anni
9.057
+0.011
0.13%
1 gen 1986 anni
9.068
+0.011
0.12%
1 gen 1987 anni
9.081
+0.013
0.14%
1 gen 1988 anni
9.094
+0.012
0.14%
1 gen 1989 anni
9.103
+0.009
0.1%
1 gen 1990 anni
9.109
+0.007
0.07%
1 gen 1991 anni
9.115
+0.006
0.06%
1 gen 1992 anni
9.122
+0.007
0.08%
1 gen 1993 anni
9.099
-0.023
-0.25%
1 gen 1994 anni
9.064
-0.035
-0.39%
1 gen 1995 anni
9.033
-0.031
-0.35%
1 gen 1996 anni
9.003
-0.029
-0.33%
1 gen 1997 anni
8.972
-0.032
-0.35%
1 gen 1998 anni
8.938
-0.034
-0.38%
1 gen 1999 anni
8.906
-0.032
-0.35%
1 gen 2000 anni
8.876
-0.03
-0.34%
1 gen 2001 anni
8.843
-0.033
-0.37%
1 gen 2002 anni
8.809
-0.034
-0.38%
1 gen 2003 anni
8.821
+0.011
0.13%
1 gen 2004 anni
8.829
+0.009
0.1%
1 gen 2005 anni
8.82
-0.009
-0.1%
1 gen 2006 anni
8.825
+0.005
0.05%
1 gen 2007 anni
8.847
+0.022
0.24%
1 gen 2008 anni
8.85
+0.004
0.04%
1 gen 2009 anni
8.84
-0.01
-0.12%
1 gen 2010 anni
8.848
+0.008
0.09%
1 gen 2011 anni
8.869
+0.021
0.24%
1 gen 2012 anni
8.903
+0.033
0.38%
1 gen 2013 anni
8.928
+0.025
0.28%
1 gen 2014 anni
8.872
-0.055
-0.62%
1 gen 2015 anni
8.837
-0.035
-0.39%
1 gen 2016 anni
8.867
+0.029
0.33%
Classificazione dei paesi secondo i statistiche attuali per anni


Commenti: