29
/it/
it
AIzaSyAYiBZKx7MnpbEhh9jyipgxe19OcubqV5w
April 1, 2024
47542
Lower middle income
LMC
false
2
1
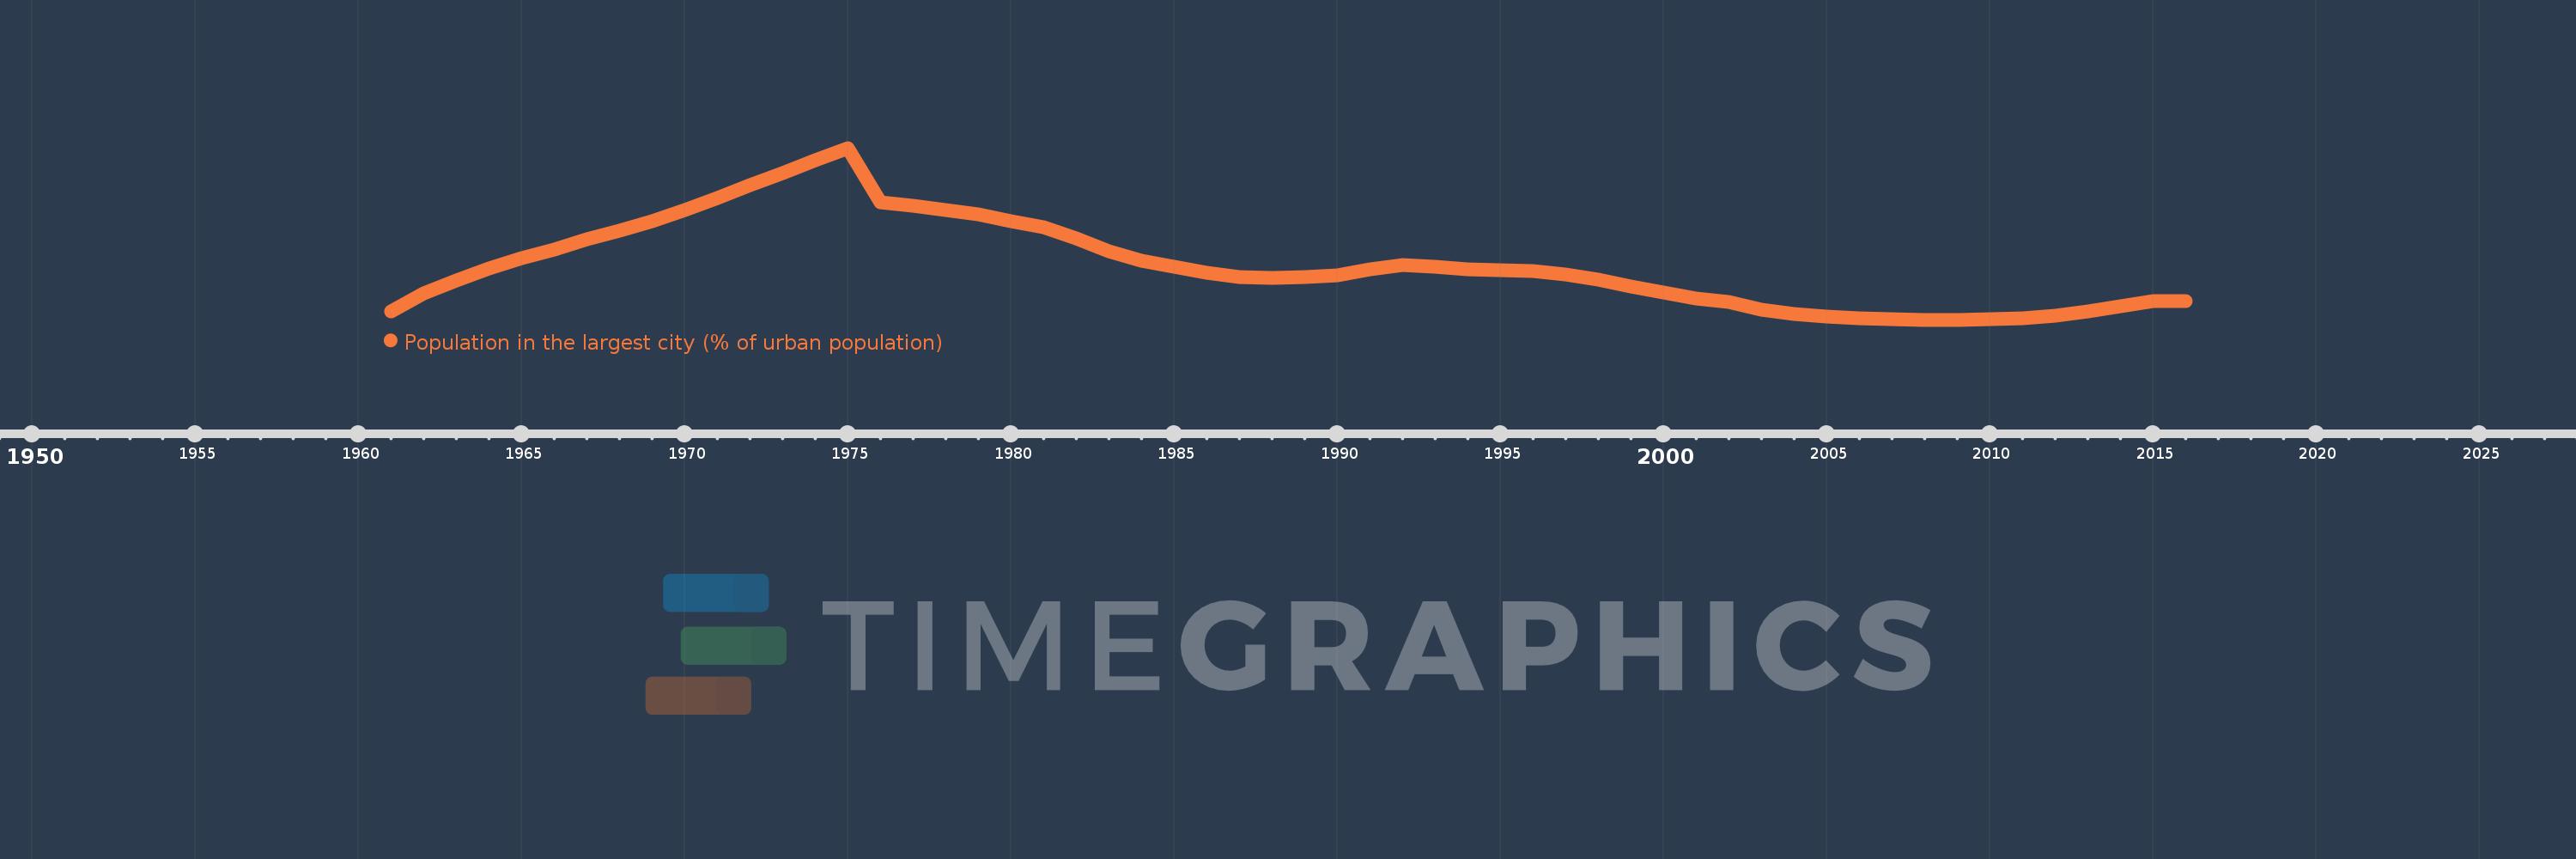
Population in the largest city (% of urban population)
2016,2015,2014,2013,2012,2011,2010,2009,2008,2007,2006,2005,2004,2003,2002,2001,2000,1999,1998,1997,1996,1995,1994,1993,1992,1991,1990,1989,1988,1987,1986,1985,1984,1983,1982,1981,1980,1979,1978,1977,1976,1975,1974,1973,1972,1971,1970,1969,1968,1967,1966,1965,1964,1963,1962,1961
Queste statistiche in altri paesi:
AfghanistanAlbaniaAlgeriaAngolaArab WorldArgentinaArmeniaAustraliaAustriaAzerbaijanBahrainBangladeshBelarusBelgiumBeninBoliviaBosnia and HerzegovinaBrazilBulgariaBurkina FasoBurundiCambodiaCameroonCanadaCentral African RepublicCentral Europe and the BalticsChadChileChinaColombiaCongo, Dem. Rep.Congo, Rep.Costa RicaCote d'IvoireCroatiaCubaCzech RepublicDenmarkDjiboutiDominican RepublicEarly-demographic dividendEast Asia & PacificEast Asia & Pacific (excluding high income)East Asia & Pacific (IDA & IBRD countries)EcuadorEgypt, Arab Rep.El SalvadorEritreaEstoniaEthiopiaEuro areaEurope & Central AsiaEurope & Central Asia (excluding high income)Europe & Central Asia (IDA & IBRD countries)European UnionFinlandFragile and conflict affected situationsFranceGabonGambia, TheGeorgiaGermanyGhanaGreeceGuatemalaGuineaGuinea-BissauHaitiHeavily indebted poor countries (HIPC)High incomeHondurasHong Kong SAR, ChinaHungaryIBRD onlyIDA & IBRD totalIDA blendIDA onlyIDA totalIndiaIndonesiaIran, Islamic Rep.IraqIrelandIsraelItalyJamaicaJapanJordanKazakhstanKenyaKorea, Dem. People’s Rep.Korea, Rep.KuwaitKyrgyz RepublicLao PDRLate-demographic dividendLatin America & Caribbean Latin America & Caribbean (excluding high income)Latin America & the Caribbean (IDA & IBRD countries)LatviaLeast developed countries: UN classificationLebanonLiberiaLibyaLithuaniaLow & middle incomeLow incomeLower middle incomeMacao SAR, ChinaMacedonia, FYRMadagascarMalawiMalaysiaMaliMauritaniaMexicoMiddle East & North AfricaMiddle East & North Africa (excluding high income)Middle East & North Africa (IDA & IBRD countries)Middle incomeMoldovaMongoliaMoroccoMozambiqueMyanmarNamibiaNepalNetherlandsNew ZealandNicaraguaNigerNigeriaNorth AmericaNorwayOECD membersOmanPakistanPanamaPapua New GuineaParaguayPeruPhilippinesPolandPortugalPost-demographic dividendPre-demographic dividendPuerto RicoQatarRomaniaRussian FederationRwandaSaudi ArabiaSenegalSerbiaSierra LeoneSingaporeSlovak RepublicSomaliaSouth AfricaSouth AsiaSouth Asia (IDA & IBRD)South SudanSpainSri LankaSub-Saharan Africa Sub-Saharan Africa (excluding high income)Sub-Saharan Africa (IDA & IBRD countries)SudanSwedenSwitzerlandSyrian Arab RepublicTajikistanTanzaniaThailandTogoTunisiaTurkeyTurkmenistanUgandaUkraineUnited Arab EmiratesUnited KingdomUnited StatesUpper middle incomeUruguayUzbekistanVenezuela, RBVietnamWest Bank and GazaWorldYemen, Rep.ZambiaZimbabwe Linea del tempo:
Questa scala temporale mostra un grafico dal 1961 anno al 2016 anno. Lower middle income. I dati fino ad 1960 anno non disponibili. Il numero di osservazioni attuali secondo i date: 56.
La fonte (nome):
Indicatori dello sviluppo mondiale
La fonte (organizzazione):
United Nations, World Urbanization Prospects.
Categorie:
Urban Development
sono stati aggiornati
23 apr 2017 anni
Indicatori delle variazioni dei valori per anni
Minima:
16.292
1 gen 2008 anni
Massimo:
17.649
1 gen 1975 anni
Alla data di osservazione
Valore
Variazione assoluta
La variazione rispetto al valore precedente
1 gen 1961 anni
16.359
+16.359
0.0%
1 gen 1962 anni
16.499
+0.14
0.85%
1 gen 1963 anni
16.603
+0.103
0.63%
1 gen 1964 anni
16.697
+0.095
0.57%
1 gen 1965 anni
16.776
+0.079
0.47%
1 gen 1966 anni
16.848
+0.072
0.43%
1 gen 1967 anni
16.928
+0.079
0.47%
1 gen 1968 anni
16.995
+0.067
0.4%
1 gen 1969 anni
17.073
+0.079
0.46%
1 gen 1970 anni
17.161
+0.087
0.51%
1 gen 1971 anni
17.251
+0.09
0.52%
1 gen 1972 anni
17.357
+0.106
0.62%
1 gen 1973 anni
17.45
+0.094
0.54%
1 gen 1974 anni
17.549
+0.098
0.56%
1 gen 1975 anni
17.649
+0.1
0.57%
1 gen 1976 anni
17.22
-0.429
-2.43%
1 gen 1977 anni
17.19
-0.03
-0.18%
1 gen 1978 anni
17.157
-0.032
-0.19%
1 gen 1979 anni
17.124
-0.033
-0.19%
1 gen 1980 anni
17.073
-0.052
-0.3%
1 gen 1981 anni
17.024
-0.049
-0.29%
1 gen 1982 anni
16.935
-0.089
-0.52%
1 gen 1983 anni
16.836
-0.098
-0.58%
1 gen 1984 anni
16.757
-0.079
-0.47%
1 gen 1985 anni
16.708
-0.049
-0.29%
1 gen 1986 anni
16.664
-0.045
-0.27%
1 gen 1987 anni
16.629
-0.034
-0.21%
1 gen 1988 anni
16.62
-0.009
-0.06%
1 gen 1989 anni
16.63
+0.01
0.06%
1 gen 1990 anni
16.644
+0.014
0.08%
1 gen 1991 anni
16.691
+0.046
0.28%
1 gen 1992 anni
16.723
+0.033
0.2%
1 gen 1993 anni
16.708
-0.015
-0.09%
1 gen 1994 anni
16.693
-0.015
-0.09%
1 gen 1995 anni
16.683
-0.01
-0.06%
1 gen 1996 anni
16.679
-0.004
-0.02%
1 gen 1997 anni
16.651
-0.028
-0.17%
1 gen 1998 anni
16.606
-0.045
-0.27%
1 gen 1999 anni
16.556
-0.05
-0.3%
1 gen 2000 anni
16.506
-0.05
-0.3%
1 gen 2001 anni
16.459
-0.047
-0.29%
1 gen 2002 anni
16.431
-0.028
-0.17%
1 gen 2003 anni
16.371
-0.06
-0.36%
1 gen 2004 anni
16.339
-0.032
-0.2%
1 gen 2005 anni
16.32
-0.019
-0.11%
1 gen 2006 anni
16.305
-0.015
-0.09%
1 gen 2007 anni
16.296
-0.009
-0.05%
1 gen 2008 anni
16.292
-0.005
-0.03%
1 gen 2009 anni
16.292
+0.0
0.0%
1 gen 2010 anni
16.296
+0.004
0.03%
1 gen 2011 anni
16.305
+0.009
0.06%
1 gen 2012 anni
16.326
+0.02
0.13%
1 gen 2013 anni
16.359
+0.033
0.2%
1 gen 2014 anni
16.396
+0.037
0.23%
1 gen 2015 anni
16.438
+0.042
0.26%
1 gen 2016 anni
16.439
+0.001
0.01%
Classificazione dei paesi secondo i statistiche attuali per anni


Commenti: