29
/it/
it
AIzaSyAYiBZKx7MnpbEhh9jyipgxe19OcubqV5w
April 1, 2024
100403
Cameroon
CMR
true
2
1
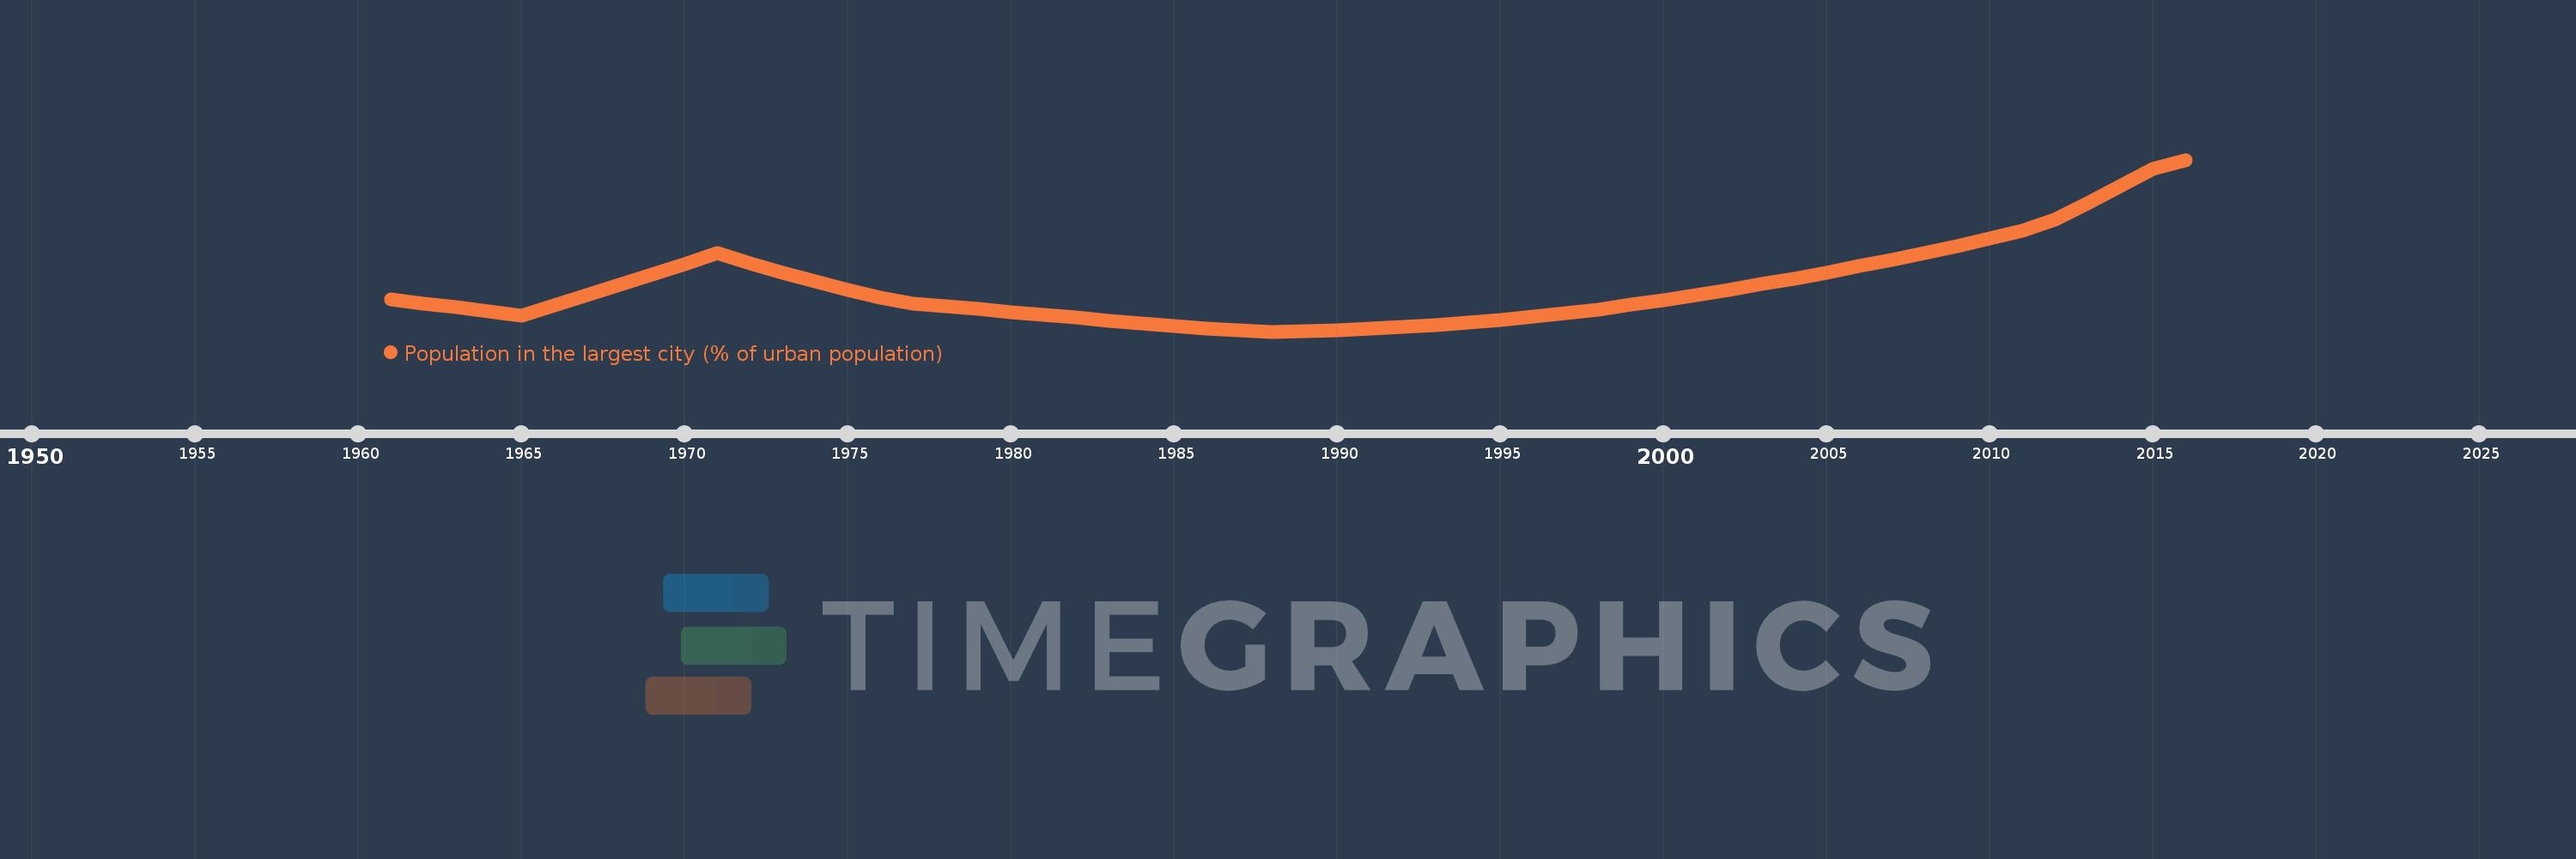
Population in the largest city (% of urban population)
2016,2015,2014,2013,2012,2011,2010,2009,2008,2007,2006,2005,2004,2003,2002,2001,2000,1999,1998,1997,1996,1995,1994,1993,1992,1991,1990,1989,1988,1987,1986,1985,1984,1983,1982,1981,1980,1979,1978,1977,1976,1975,1974,1973,1972,1971,1970,1969,1968,1967,1966,1965,1964,1963,1962,1961
Queste statistiche in altri paesi:
AfghanistanAlbaniaAlgeriaAngolaArab WorldArgentinaArmeniaAustraliaAustriaAzerbaijanBahrainBangladeshBelarusBelgiumBeninBoliviaBosnia and HerzegovinaBrazilBulgariaBurkina FasoBurundiCambodiaCameroonCanadaCentral African RepublicCentral Europe and the BalticsChadChileChinaColombiaCongo, Dem. Rep.Congo, Rep.Costa RicaCote d'IvoireCroatiaCubaCzech RepublicDenmarkDjiboutiDominican RepublicEarly-demographic dividendEast Asia & PacificEast Asia & Pacific (excluding high income)East Asia & Pacific (IDA & IBRD countries)EcuadorEgypt, Arab Rep.El SalvadorEritreaEstoniaEthiopiaEuro areaEurope & Central AsiaEurope & Central Asia (excluding high income)Europe & Central Asia (IDA & IBRD countries)European UnionFinlandFragile and conflict affected situationsFranceGabonGambia, TheGeorgiaGermanyGhanaGreeceGuatemalaGuineaGuinea-BissauHaitiHeavily indebted poor countries (HIPC)High incomeHondurasHong Kong SAR, ChinaHungaryIBRD onlyIDA & IBRD totalIDA blendIDA onlyIDA totalIndiaIndonesiaIran, Islamic Rep.IraqIrelandIsraelItalyJamaicaJapanJordanKazakhstanKenyaKorea, Dem. People’s Rep.Korea, Rep.KuwaitKyrgyz RepublicLao PDRLate-demographic dividendLatin America & Caribbean Latin America & Caribbean (excluding high income)Latin America & the Caribbean (IDA & IBRD countries)LatviaLeast developed countries: UN classificationLebanonLiberiaLibyaLithuaniaLow & middle incomeLow incomeLower middle incomeMacao SAR, ChinaMacedonia, FYRMadagascarMalawiMalaysiaMaliMauritaniaMexicoMiddle East & North AfricaMiddle East & North Africa (excluding high income)Middle East & North Africa (IDA & IBRD countries)Middle incomeMoldovaMongoliaMoroccoMozambiqueMyanmarNamibiaNepalNetherlandsNew ZealandNicaraguaNigerNigeriaNorth AmericaNorwayOECD membersOmanPakistanPanamaPapua New GuineaParaguayPeruPhilippinesPolandPortugalPost-demographic dividendPre-demographic dividendPuerto RicoQatarRomaniaRussian FederationRwandaSaudi ArabiaSenegalSerbiaSierra LeoneSingaporeSlovak RepublicSomaliaSouth AfricaSouth AsiaSouth Asia (IDA & IBRD)South SudanSpainSri LankaSub-Saharan Africa Sub-Saharan Africa (excluding high income)Sub-Saharan Africa (IDA & IBRD countries)SudanSwedenSwitzerlandSyrian Arab RepublicTajikistanTanzaniaThailandTogoTunisiaTurkeyTurkmenistanUgandaUkraineUnited Arab EmiratesUnited KingdomUnited StatesUpper middle incomeUruguayUzbekistanVenezuela, RBVietnamWest Bank and GazaWorldYemen, Rep.ZambiaZimbabwe Linea del tempo:
Questa scala temporale mostra un grafico dal 1961 anno al 2016 anno. Cameroon. I dati fino ad 1960 anno non disponibili. Il numero di osservazioni attuali secondo i date: 56.
La fonte (nome):
Indicatori dello sviluppo mondiale
La fonte (organizzazione):
United Nations, World Urbanization Prospects.
Categorie:
Urban Development
sono stati aggiornati
23 apr 2017 anni
Indicatori delle variazioni dei valori per anni
Minima:
19.572
1 gen 1988 anni
Massimo:
24.149
1 gen 2016 anni
Alla data di osservazione
Valore
Variazione assoluta
La variazione rispetto al valore precedente
1 gen 1961 anni
20.424
+20.424
0.0%
1 gen 1962 anni
20.326
-0.098
-0.48%
1 gen 1963 anni
20.22
-0.106
-0.52%
1 gen 1964 anni
20.106
-0.113
-0.56%
1 gen 1965 anni
19.989
-0.117
-0.58%
1 gen 1966 anni
20.266
+0.277
1.38%
1 gen 1967 anni
20.544
+0.278
1.37%
1 gen 1968 anni
20.821
+0.277
1.35%
1 gen 1969 anni
21.1
+0.279
1.34%
1 gen 1970 anni
21.378
+0.278
1.32%
1 gen 1971 anni
21.658
+0.28
1.31%
1 gen 1972 anni
21.389
-0.269
-1.24%
1 gen 1973 anni
21.137
-0.252
-1.18%
1 gen 1974 anni
20.901
-0.236
-1.12%
1 gen 1975 anni
20.682
-0.219
-1.05%
1 gen 1976 anni
20.48
-0.202
-0.98%
1 gen 1977 anni
20.321
-0.159
-0.78%
1 gen 1978 anni
20.245
-0.075
-0.37%
1 gen 1979 anni
20.17
-0.076
-0.37%
1 gen 1980 anni
20.093
-0.076
-0.38%
1 gen 1981 anni
20.017
-0.076
-0.38%
1 gen 1982 anni
19.94
-0.077
-0.39%
1 gen 1983 anni
19.865
-0.075
-0.37%
1 gen 1984 anni
19.793
-0.072
-0.36%
1 gen 1985 anni
19.726
-0.067
-0.34%
1 gen 1986 anni
19.663
-0.063
-0.32%
1 gen 1987 anni
19.607
-0.056
-0.29%
1 gen 1988 anni
19.572
-0.034
-0.18%
1 gen 1989 anni
19.59
+0.018
0.09%
1 gen 1990 anni
19.614
+0.024
0.12%
1 gen 1991 anni
19.648
+0.033
0.17%
1 gen 1992 anni
19.69
+0.043
0.22%
1 gen 1993 anni
19.743
+0.053
0.27%
1 gen 1994 anni
19.805
+0.062
0.31%
1 gen 1995 anni
19.878
+0.073
0.37%
1 gen 1996 anni
19.963
+0.085
0.43%
1 gen 1997 anni
20.06
+0.097
0.49%
1 gen 1998 anni
20.167
+0.107
0.53%
1 gen 1999 anni
20.284
+0.118
0.58%
1 gen 2000 anni
20.41
+0.126
0.62%
1 gen 2001 anni
20.545
+0.134
0.66%
1 gen 2002 anni
20.685
+0.14
0.68%
1 gen 2003 anni
20.834
+0.149
0.72%
1 gen 2004 anni
20.989
+0.155
0.75%
1 gen 2005 anni
21.151
+0.162
0.77%
1 gen 2006 anni
21.318
+0.166
0.79%
1 gen 2007 anni
21.491
+0.173
0.81%
1 gen 2008 anni
21.672
+0.181
0.84%
1 gen 2009 anni
21.86
+0.188
0.87%
1 gen 2010 anni
22.056
+0.196
0.9%
1 gen 2011 anni
22.259
+0.203
0.92%
1 gen 2012 anni
22.56
+0.301
1.35%
1 gen 2013 anni
22.993
+0.433
1.92%
1 gen 2014 anni
23.441
+0.449
1.95%
1 gen 2015 anni
23.908
+0.466
1.99%
1 gen 2016 anni
24.149
+0.242
1.01%
Classificazione dei paesi secondo i statistiche attuali per anni


Commenti: