29
/it/
it
AIzaSyAYiBZKx7MnpbEhh9jyipgxe19OcubqV5w
April 1, 2024
43792
Latin America & the Caribbean (IDA & IBRD countries)
TLA
false
2
1
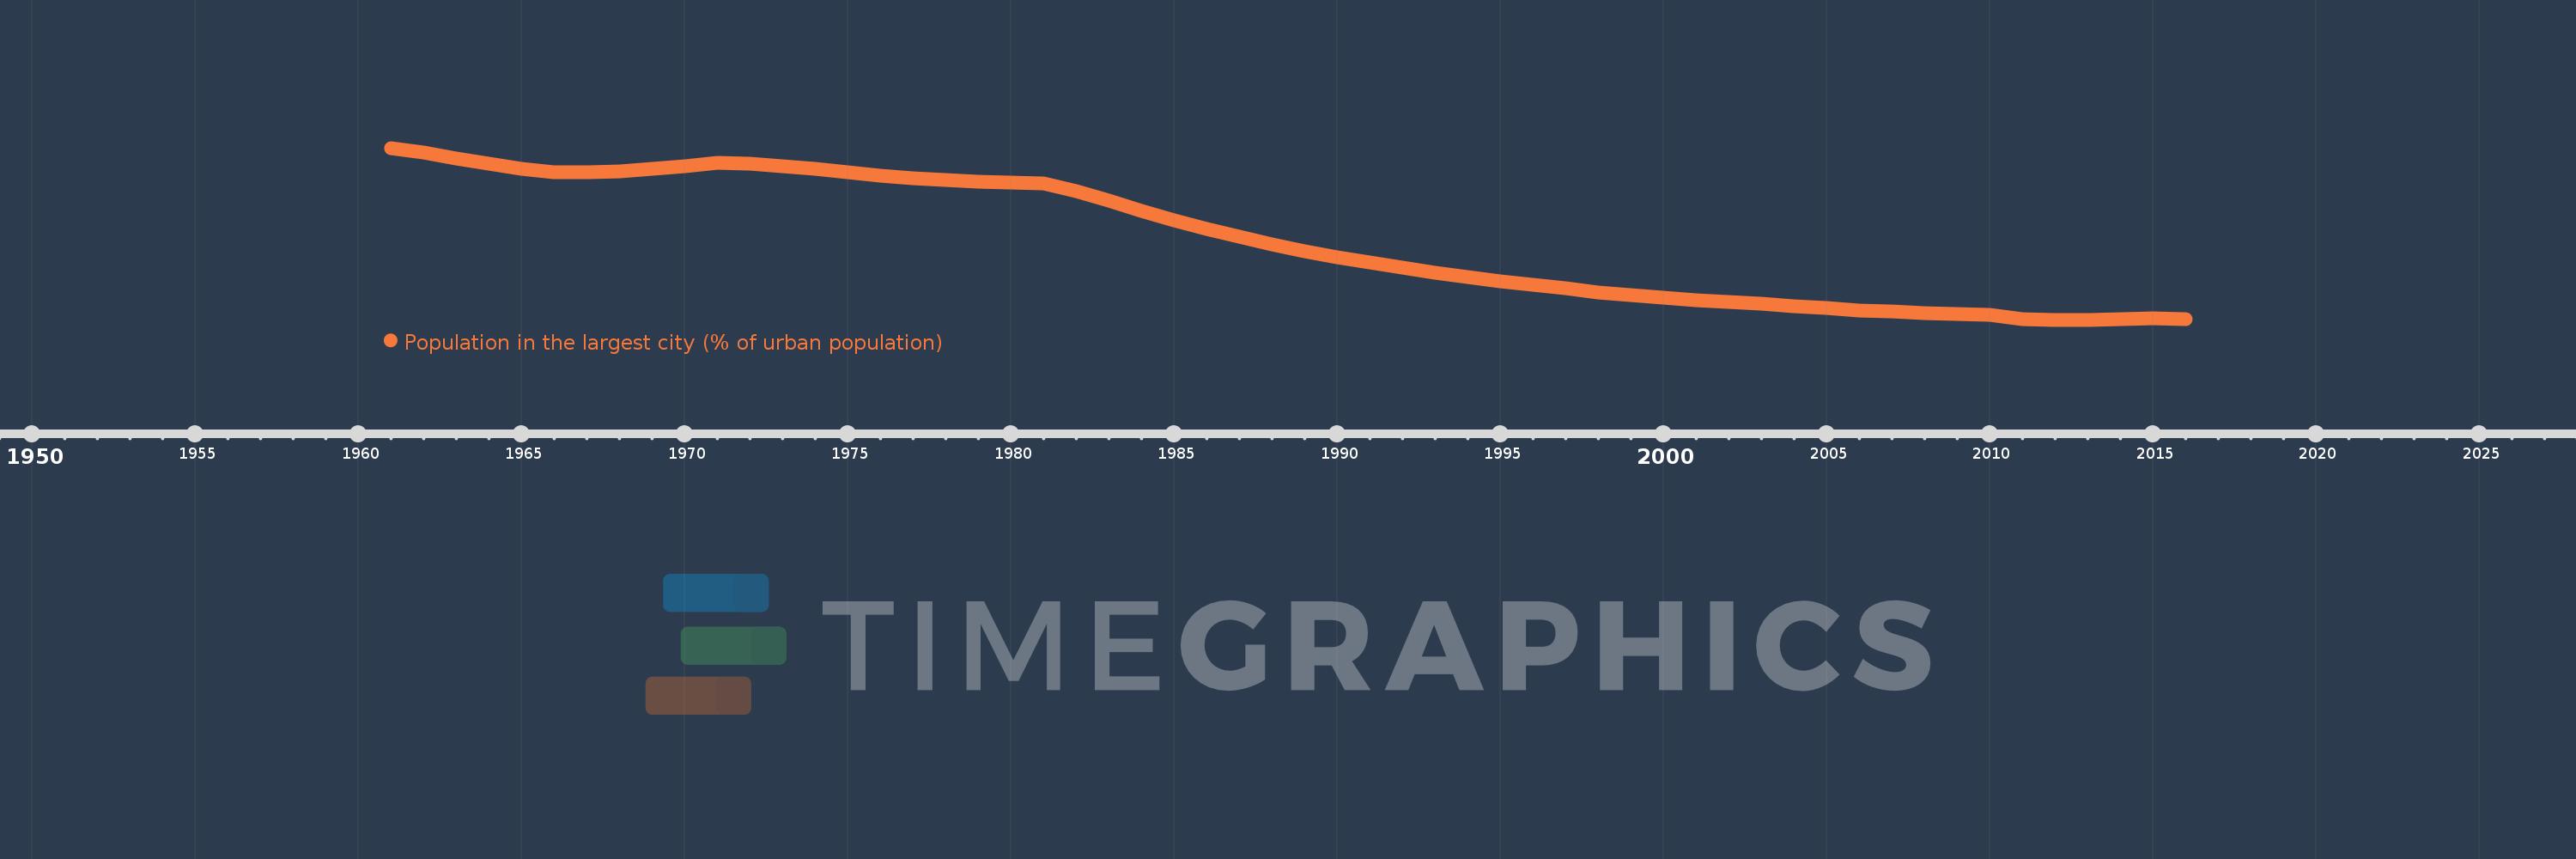
Population in the largest city (% of urban population)
2016,2015,2014,2013,2012,2011,2010,2009,2008,2007,2006,2005,2004,2003,2002,2001,2000,1999,1998,1997,1996,1995,1994,1993,1992,1991,1990,1989,1988,1987,1986,1985,1984,1983,1982,1981,1980,1979,1978,1977,1976,1975,1974,1973,1972,1971,1970,1969,1968,1967,1966,1965,1964,1963,1962,1961
Queste statistiche in altri paesi:
AfghanistanAlbaniaAlgeriaAngolaArab WorldArgentinaArmeniaAustraliaAustriaAzerbaijanBahrainBangladeshBelarusBelgiumBeninBoliviaBosnia and HerzegovinaBrazilBulgariaBurkina FasoBurundiCambodiaCameroonCanadaCentral African RepublicCentral Europe and the BalticsChadChileChinaColombiaCongo, Dem. Rep.Congo, Rep.Costa RicaCote d'IvoireCroatiaCubaCzech RepublicDenmarkDjiboutiDominican RepublicEarly-demographic dividendEast Asia & PacificEast Asia & Pacific (excluding high income)East Asia & Pacific (IDA & IBRD countries)EcuadorEgypt, Arab Rep.El SalvadorEritreaEstoniaEthiopiaEuro areaEurope & Central AsiaEurope & Central Asia (excluding high income)Europe & Central Asia (IDA & IBRD countries)European UnionFinlandFragile and conflict affected situationsFranceGabonGambia, TheGeorgiaGermanyGhanaGreeceGuatemalaGuineaGuinea-BissauHaitiHeavily indebted poor countries (HIPC)High incomeHondurasHong Kong SAR, ChinaHungaryIBRD onlyIDA & IBRD totalIDA blendIDA onlyIDA totalIndiaIndonesiaIran, Islamic Rep.IraqIrelandIsraelItalyJamaicaJapanJordanKazakhstanKenyaKorea, Dem. People’s Rep.Korea, Rep.KuwaitKyrgyz RepublicLao PDRLate-demographic dividendLatin America & Caribbean Latin America & Caribbean (excluding high income)Latin America & the Caribbean (IDA & IBRD countries)LatviaLeast developed countries: UN classificationLebanonLiberiaLibyaLithuaniaLow & middle incomeLow incomeLower middle incomeMacao SAR, ChinaMacedonia, FYRMadagascarMalawiMalaysiaMaliMauritaniaMexicoMiddle East & North AfricaMiddle East & North Africa (excluding high income)Middle East & North Africa (IDA & IBRD countries)Middle incomeMoldovaMongoliaMoroccoMozambiqueMyanmarNamibiaNepalNetherlandsNew ZealandNicaraguaNigerNigeriaNorth AmericaNorwayOECD membersOmanPakistanPanamaPapua New GuineaParaguayPeruPhilippinesPolandPortugalPost-demographic dividendPre-demographic dividendPuerto RicoQatarRomaniaRussian FederationRwandaSaudi ArabiaSenegalSerbiaSierra LeoneSingaporeSlovak RepublicSomaliaSouth AfricaSouth AsiaSouth Asia (IDA & IBRD)South SudanSpainSri LankaSub-Saharan Africa Sub-Saharan Africa (excluding high income)Sub-Saharan Africa (IDA & IBRD countries)SudanSwedenSwitzerlandSyrian Arab RepublicTajikistanTanzaniaThailandTogoTunisiaTurkeyTurkmenistanUgandaUkraineUnited Arab EmiratesUnited KingdomUnited StatesUpper middle incomeUruguayUzbekistanVenezuela, RBVietnamWest Bank and GazaWorldYemen, Rep.ZambiaZimbabwe Linea del tempo:
Questa scala temporale mostra un grafico dal 1961 anno al 2016 anno. Latin America & the Caribbean (IDA & IBRD countries). I dati fino ad 1960 anno non disponibili. Il numero di osservazioni attuali secondo i date: 56.
La fonte (nome):
Indicatori dello sviluppo mondiale
La fonte (organizzazione):
United Nations, World Urbanization Prospects.
Categorie:
Urban Development
sono stati aggiornati
23 apr 2017 anni
Indicatori delle variazioni dei valori per anni
Minima:
22.389
1 gen 2012 anni
Massimo:
27.538
1 gen 1961 anni
Alla data di osservazione
Valore
Variazione assoluta
La variazione rispetto al valore precedente
1 gen 1961 anni
27.538
+27.538
0.0%
1 gen 1962 anni
27.389
-0.148
-0.54%
1 gen 1963 anni
27.22
-0.17
-0.62%
1 gen 1964 anni
27.061
-0.159
-0.58%
1 gen 1965 anni
26.92
-0.141
-0.52%
1 gen 1966 anni
26.804
-0.116
-0.43%
1 gen 1967 anni
26.797
-0.007
-0.03%
1 gen 1968 anni
26.839
+0.042
0.16%
1 gen 1969 anni
26.907
+0.068
0.25%
1 gen 1970 anni
26.995
+0.088
0.33%
1 gen 1971 anni
27.083
+0.088
0.33%
1 gen 1972 anni
27.061
-0.022
-0.08%
1 gen 1973 anni
27.0
-0.061
-0.23%
1 gen 1974 anni
26.918
-0.082
-0.3%
1 gen 1975 anni
26.817
-0.101
-0.38%
1 gen 1976 anni
26.718
-0.098
-0.37%
1 gen 1977 anni
26.64
-0.078
-0.29%
1 gen 1978 anni
26.575
-0.065
-0.24%
1 gen 1979 anni
26.527
-0.048
-0.18%
1 gen 1980 anni
26.497
-0.031
-0.12%
1 gen 1981 anni
26.476
-0.021
-0.08%
1 gen 1982 anni
26.241
-0.235
-0.89%
1 gen 1983 anni
25.956
-0.285
-1.09%
1 gen 1984 anni
25.657
-0.299
-1.15%
1 gen 1985 anni
25.376
-0.281
-1.1%
1 gen 1986 anni
25.113
-0.263
-1.04%
1 gen 1987 anni
24.872
-0.24
-0.96%
1 gen 1988 anni
24.653
-0.22
-0.88%
1 gen 1989 anni
24.452
-0.201
-0.81%
1 gen 1990 anni
24.264
-0.187
-0.77%
1 gen 1991 anni
24.094
-0.17
-0.7%
1 gen 1992 anni
23.942
-0.152
-0.63%
1 gen 1993 anni
23.803
-0.139
-0.58%
1 gen 1994 anni
23.669
-0.134
-0.56%
1 gen 1995 anni
23.541
-0.128
-0.54%
1 gen 1996 anni
23.431
-0.11
-0.47%
1 gen 1997 anni
23.325
-0.106
-0.45%
1 gen 1998 anni
23.217
-0.109
-0.47%
1 gen 1999 anni
23.122
-0.095
-0.41%
1 gen 2000 anni
23.044
-0.077
-0.34%
1 gen 2001 anni
22.977
-0.068
-0.29%
1 gen 2002 anni
22.918
-0.059
-0.26%
1 gen 2003 anni
22.864
-0.053
-0.23%
1 gen 2004 anni
22.794
-0.07
-0.31%
1 gen 2005 anni
22.73
-0.064
-0.28%
1 gen 2006 anni
22.675
-0.054
-0.24%
1 gen 2007 anni
22.629
-0.046
-0.2%
1 gen 2008 anni
22.592
-0.038
-0.17%
1 gen 2009 anni
22.563
-0.029
-0.13%
1 gen 2010 anni
22.543
-0.02
-0.09%
1 gen 2011 anni
22.396
-0.147
-0.65%
1 gen 2012 anni
22.389
-0.007
-0.03%
1 gen 2013 anni
22.393
+0.003
0.01%
1 gen 2014 anni
22.405
+0.013
0.06%
1 gen 2015 anni
22.428
+0.023
0.1%
1 gen 2016 anni
22.398
-0.03
-0.13%
Classificazione dei paesi secondo i statistiche attuali per anni


Commenti: