29
/it/
it
AIzaSyAYiBZKx7MnpbEhh9jyipgxe19OcubqV5w
April 1, 2024
158846
Iraq
IRQ
true
2
1
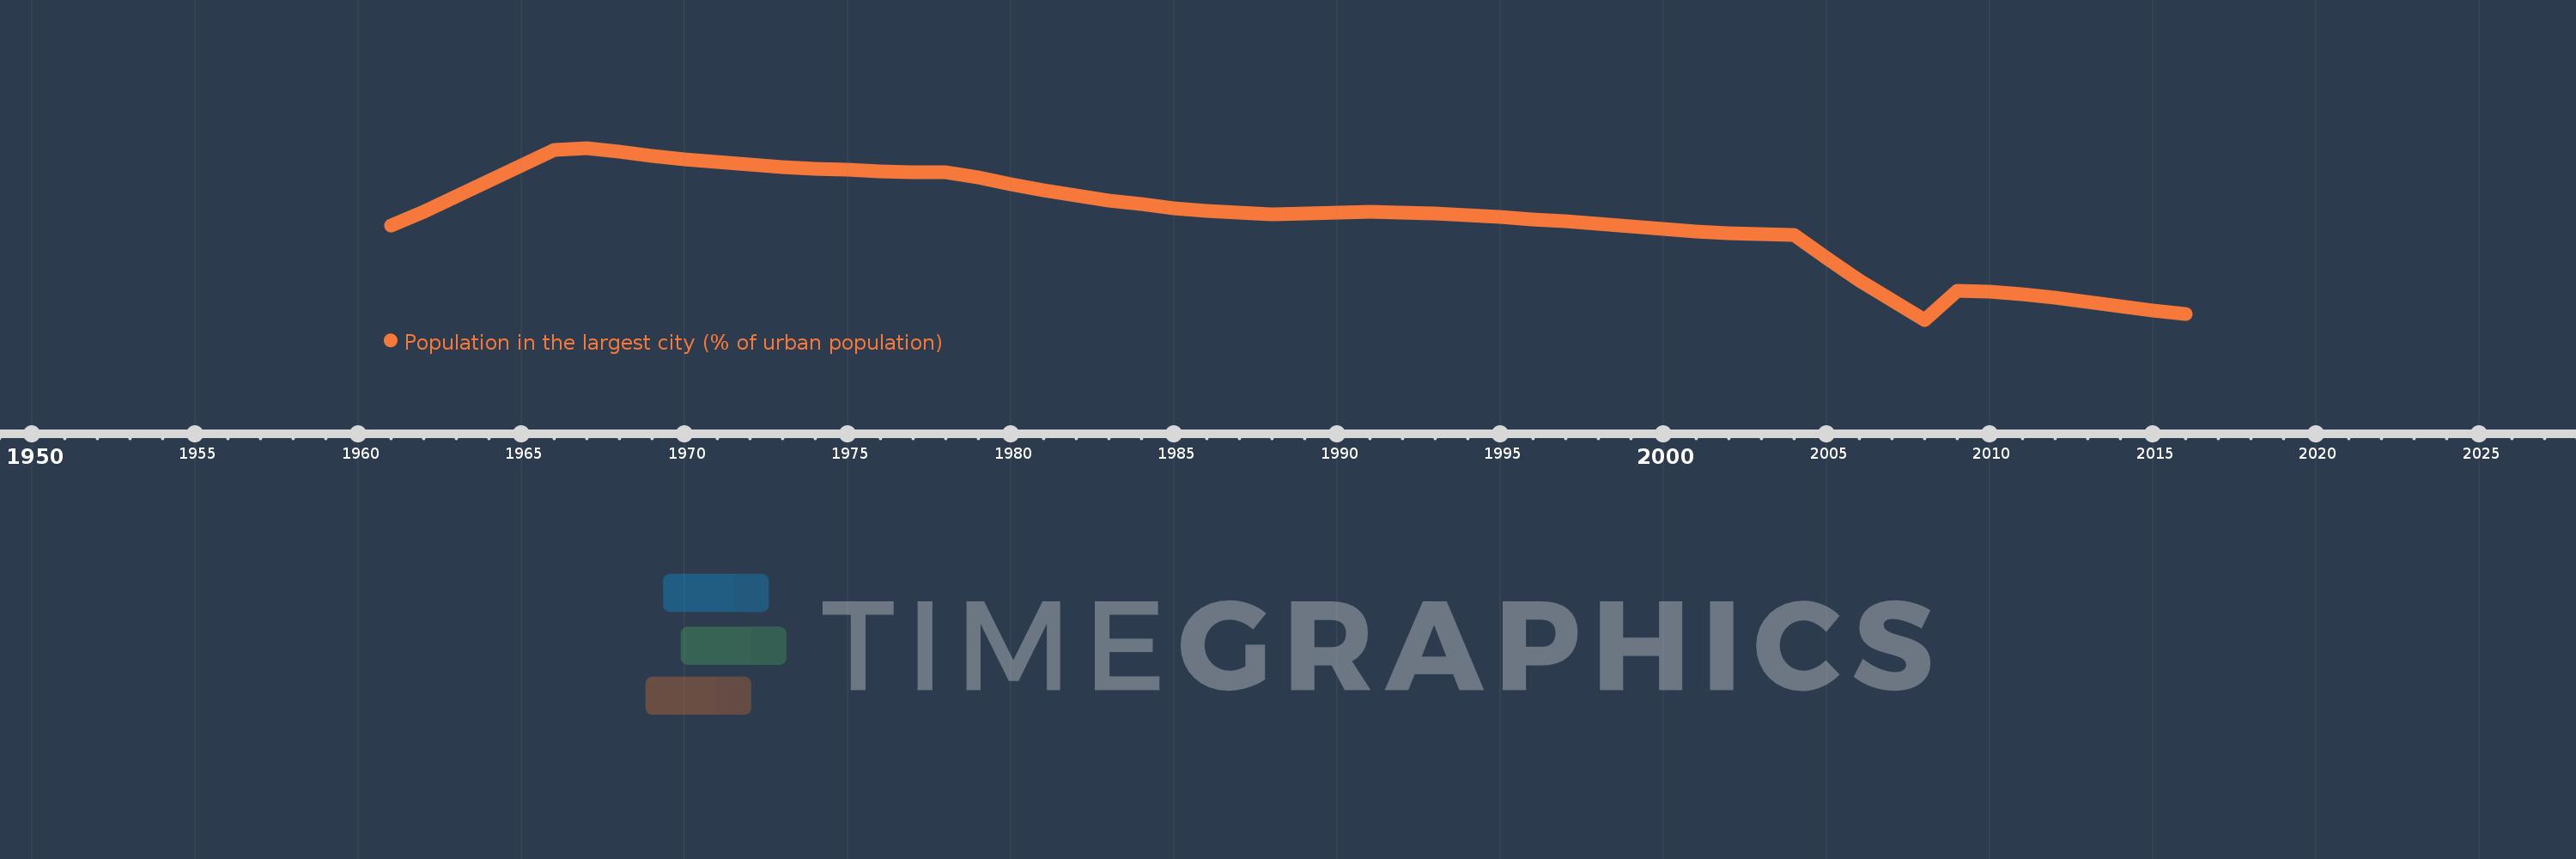
Population in the largest city (% of urban population)
2016,2015,2014,2013,2012,2011,2010,2009,2008,2007,2006,2005,2004,2003,2002,2001,2000,1999,1998,1997,1996,1995,1994,1993,1992,1991,1990,1989,1988,1987,1986,1985,1984,1983,1982,1981,1980,1979,1978,1977,1976,1975,1974,1973,1972,1971,1970,1969,1968,1967,1966,1965,1964,1963,1962,1961
Queste statistiche in altri paesi:
AfghanistanAlbaniaAlgeriaAngolaArab WorldArgentinaArmeniaAustraliaAustriaAzerbaijanBahrainBangladeshBelarusBelgiumBeninBoliviaBosnia and HerzegovinaBrazilBulgariaBurkina FasoBurundiCambodiaCameroonCanadaCentral African RepublicCentral Europe and the BalticsChadChileChinaColombiaCongo, Dem. Rep.Congo, Rep.Costa RicaCote d'IvoireCroatiaCubaCzech RepublicDenmarkDjiboutiDominican RepublicEarly-demographic dividendEast Asia & PacificEast Asia & Pacific (excluding high income)East Asia & Pacific (IDA & IBRD countries)EcuadorEgypt, Arab Rep.El SalvadorEritreaEstoniaEthiopiaEuro areaEurope & Central AsiaEurope & Central Asia (excluding high income)Europe & Central Asia (IDA & IBRD countries)European UnionFinlandFragile and conflict affected situationsFranceGabonGambia, TheGeorgiaGermanyGhanaGreeceGuatemalaGuineaGuinea-BissauHaitiHeavily indebted poor countries (HIPC)High incomeHondurasHong Kong SAR, ChinaHungaryIBRD onlyIDA & IBRD totalIDA blendIDA onlyIDA totalIndiaIndonesiaIran, Islamic Rep.IraqIrelandIsraelItalyJamaicaJapanJordanKazakhstanKenyaKorea, Dem. People’s Rep.Korea, Rep.KuwaitKyrgyz RepublicLao PDRLate-demographic dividendLatin America & Caribbean Latin America & Caribbean (excluding high income)Latin America & the Caribbean (IDA & IBRD countries)LatviaLeast developed countries: UN classificationLebanonLiberiaLibyaLithuaniaLow & middle incomeLow incomeLower middle incomeMacao SAR, ChinaMacedonia, FYRMadagascarMalawiMalaysiaMaliMauritaniaMexicoMiddle East & North AfricaMiddle East & North Africa (excluding high income)Middle East & North Africa (IDA & IBRD countries)Middle incomeMoldovaMongoliaMoroccoMozambiqueMyanmarNamibiaNepalNetherlandsNew ZealandNicaraguaNigerNigeriaNorth AmericaNorwayOECD membersOmanPakistanPanamaPapua New GuineaParaguayPeruPhilippinesPolandPortugalPost-demographic dividendPre-demographic dividendPuerto RicoQatarRomaniaRussian FederationRwandaSaudi ArabiaSenegalSerbiaSierra LeoneSingaporeSlovak RepublicSomaliaSouth AfricaSouth AsiaSouth Asia (IDA & IBRD)South SudanSpainSri LankaSub-Saharan Africa Sub-Saharan Africa (excluding high income)Sub-Saharan Africa (IDA & IBRD countries)SudanSwedenSwitzerlandSyrian Arab RepublicTajikistanTanzaniaThailandTogoTunisiaTurkeyTurkmenistanUgandaUkraineUnited Arab EmiratesUnited KingdomUnited StatesUpper middle incomeUruguayUzbekistanVenezuela, RBVietnamWest Bank and GazaWorldYemen, Rep.ZambiaZimbabwe Linea del tempo:
Questa scala temporale mostra un grafico dal 1961 anno al 2016 anno. Iraq. I dati fino ad 1960 anno non disponibili. Il numero di osservazioni attuali secondo i date: 56.
La fonte (nome):
Indicatori dello sviluppo mondiale
La fonte (organizzazione):
United Nations, World Urbanization Prospects.
Categorie:
Urban Development
sono stati aggiornati
23 apr 2017 anni
Indicatori delle variazioni dei valori per anni
Minima:
25.817
1 gen 2008 anni
Massimo:
38.199
1 gen 1967 anni
Alla data di osservazione
Valore
Variazione assoluta
La variazione rispetto al valore precedente
1 gen 1961 anni
32.578
+32.578
0.0%
1 gen 1962 anni
33.627
+1.049
3.22%
1 gen 1963 anni
34.706
+1.08
3.21%
1 gen 1964 anni
35.807
+1.101
3.17%
1 gen 1965 anni
36.924
+1.117
3.12%
1 gen 1966 anni
38.047
+1.122
3.04%
1 gen 1967 anni
38.199
+0.152
0.4%
1 gen 1968 anni
37.929
-0.269
-0.7%
1 gen 1969 anni
37.654
-0.276
-0.73%
1 gen 1970 anni
37.391
-0.262
-0.7%
1 gen 1971 anni
37.165
-0.227
-0.61%
1 gen 1972 anni
36.977
-0.187
-0.5%
1 gen 1973 anni
36.828
-0.149
-0.4%
1 gen 1974 anni
36.708
-0.121
-0.33%
1 gen 1975 anni
36.611
-0.097
-0.26%
1 gen 1976 anni
36.533
-0.077
-0.21%
1 gen 1977 anni
36.477
-0.057
-0.16%
1 gen 1978 anni
36.443
-0.034
-0.09%
1 gen 1979 anni
36.07
-0.372
-1.02%
1 gen 1980 anni
35.584
-0.486
-1.35%
1 gen 1981 anni
35.153
-0.431
-1.21%
1 gen 1982 anni
34.768
-0.386
-1.1%
1 gen 1983 anni
34.424
-0.343
-0.99%
1 gen 1984 anni
34.126
-0.298
-0.87%
1 gen 1985 anni
33.877
-0.249
-0.73%
1 gen 1986 anni
33.673
-0.204
-0.6%
1 gen 1987 anni
33.518
-0.155
-0.46%
1 gen 1988 anni
33.398
-0.119
-0.36%
1 gen 1989 anni
33.456
+0.057
0.17%
1 gen 1990 anni
33.548
+0.093
0.28%
1 gen 1991 anni
33.583
+0.035
0.1%
1 gen 1992 anni
33.557
-0.026
-0.08%
1 gen 1993 anni
33.481
-0.076
-0.23%
1 gen 1994 anni
33.363
-0.118
-0.35%
1 gen 1995 anni
33.222
-0.141
-0.42%
1 gen 1996 anni
33.068
-0.153
-0.46%
1 gen 1997 anni
32.905
-0.163
-0.49%
1 gen 1998 anni
32.732
-0.173
-0.53%
1 gen 1999 anni
32.537
-0.195
-0.6%
1 gen 2000 anni
32.353
-0.184
-0.57%
1 gen 2001 anni
32.202
-0.151
-0.47%
1 gen 2002 anni
32.08
-0.122
-0.38%
1 gen 2003 anni
31.984
-0.096
-0.3%
1 gen 2004 anni
31.91
-0.074
-0.23%
1 gen 2005 anni
30.241
-1.669
-5.23%
1 gen 2006 anni
28.674
-1.567
-5.18%
1 gen 2007 anni
27.203
-1.47
-5.13%
1 gen 2008 anni
25.817
-1.386
-5.09%
1 gen 2009 anni
27.934
+2.117
8.2%
1 gen 2010 anni
27.819
-0.116
-0.41%
1 gen 2011 anni
27.643
-0.175
-0.63%
1 gen 2012 anni
27.4
-0.243
-0.88%
1 gen 2013 anni
27.106
-0.294
-1.07%
1 gen 2014 anni
26.794
-0.312
-1.15%
1 gen 2015 anni
26.499
-0.295
-1.1%
1 gen 2016 anni
26.252
-0.246
-0.93%
Classificazione dei paesi secondo i statistiche attuali per anni


Commenti: