29
/it/
it
AIzaSyAYiBZKx7MnpbEhh9jyipgxe19OcubqV5w
April 1, 2024
26048
Central Europe and the Baltics
CEB
false
2
1
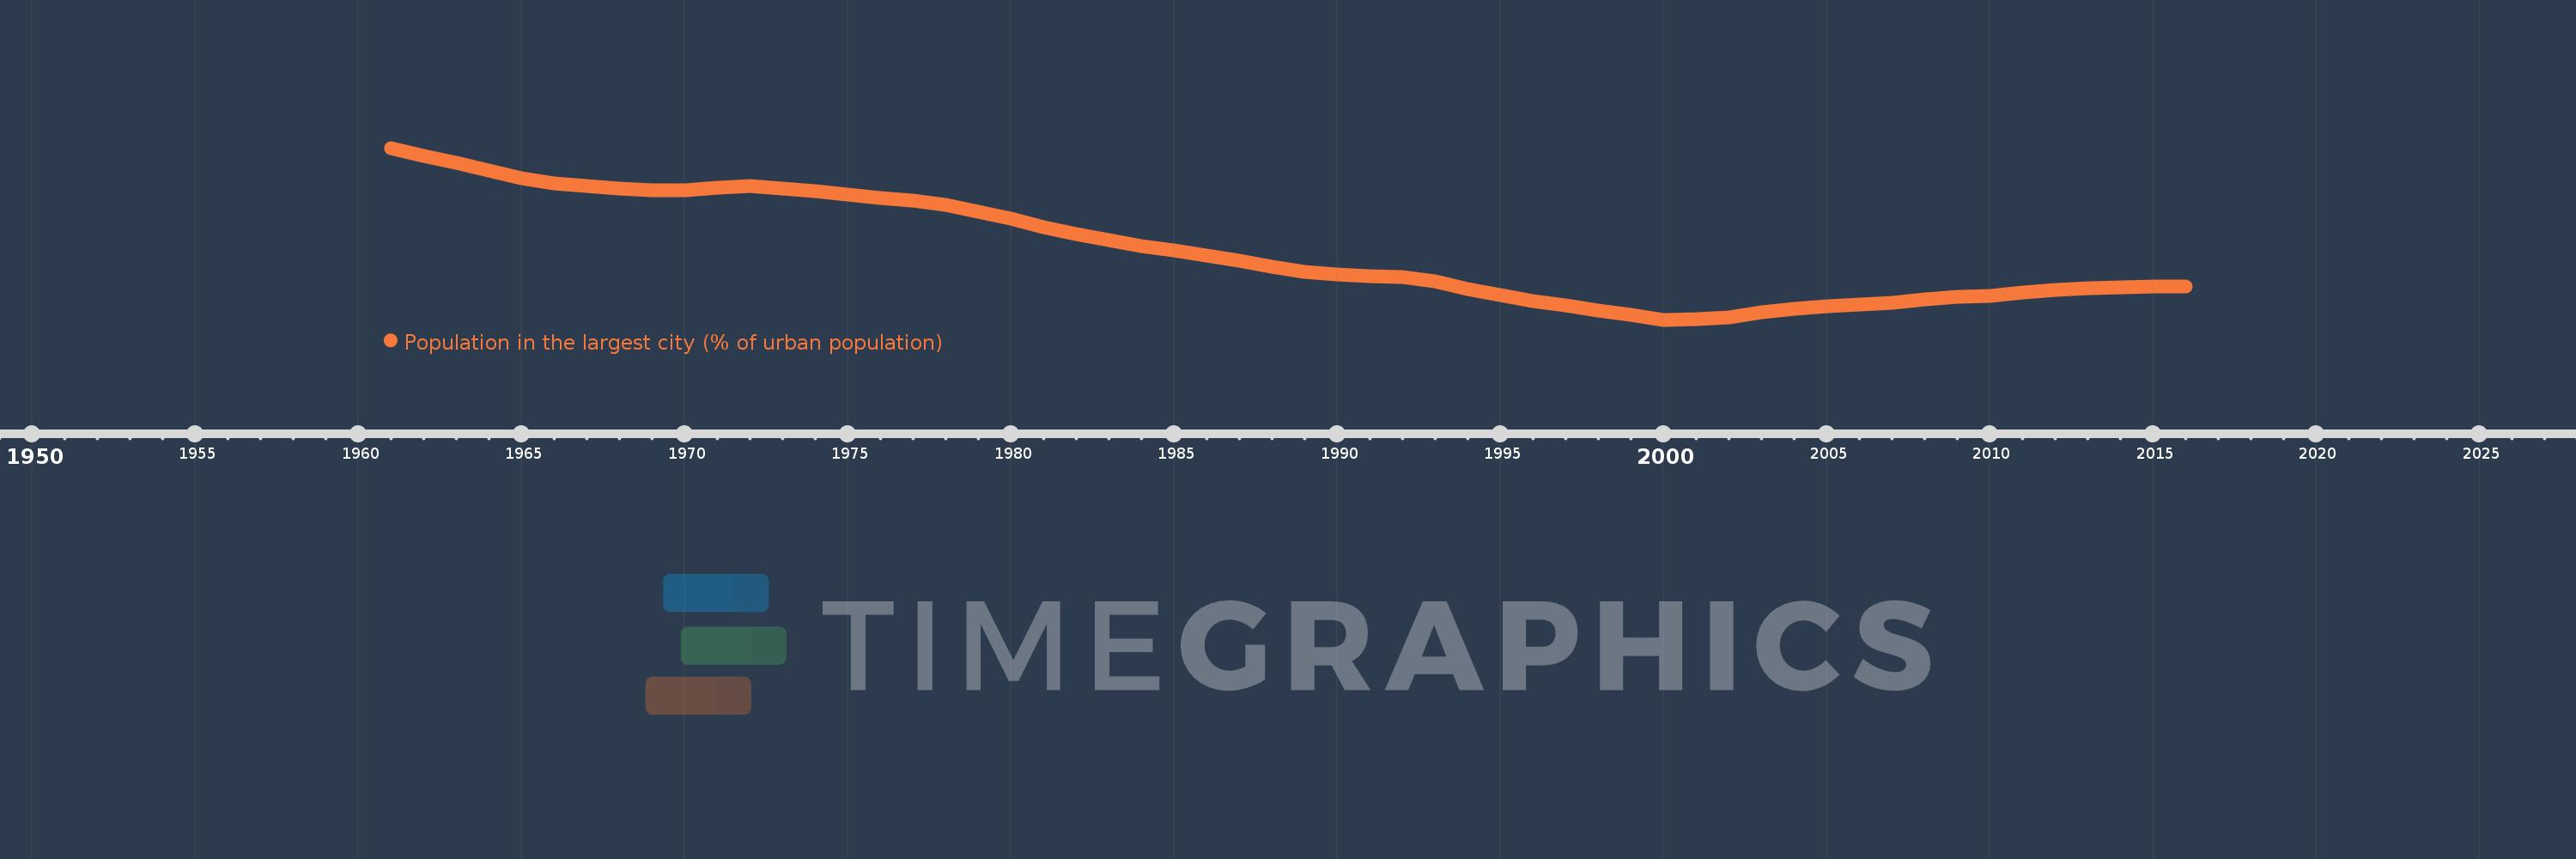
Population in the largest city (% of urban population)
2016,2015,2014,2013,2012,2011,2010,2009,2008,2007,2006,2005,2004,2003,2002,2001,2000,1999,1998,1997,1996,1995,1994,1993,1992,1991,1990,1989,1988,1987,1986,1985,1984,1983,1982,1981,1980,1979,1978,1977,1976,1975,1974,1973,1972,1971,1970,1969,1968,1967,1966,1965,1964,1963,1962,1961
Queste statistiche in altri paesi:
AfghanistanAlbaniaAlgeriaAngolaArab WorldArgentinaArmeniaAustraliaAustriaAzerbaijanBahrainBangladeshBelarusBelgiumBeninBoliviaBosnia and HerzegovinaBrazilBulgariaBurkina FasoBurundiCambodiaCameroonCanadaCentral African RepublicCentral Europe and the BalticsChadChileChinaColombiaCongo, Dem. Rep.Congo, Rep.Costa RicaCote d'IvoireCroatiaCubaCzech RepublicDenmarkDjiboutiDominican RepublicEarly-demographic dividendEast Asia & PacificEast Asia & Pacific (excluding high income)East Asia & Pacific (IDA & IBRD countries)EcuadorEgypt, Arab Rep.El SalvadorEritreaEstoniaEthiopiaEuro areaEurope & Central AsiaEurope & Central Asia (excluding high income)Europe & Central Asia (IDA & IBRD countries)European UnionFinlandFragile and conflict affected situationsFranceGabonGambia, TheGeorgiaGermanyGhanaGreeceGuatemalaGuineaGuinea-BissauHaitiHeavily indebted poor countries (HIPC)High incomeHondurasHong Kong SAR, ChinaHungaryIBRD onlyIDA & IBRD totalIDA blendIDA onlyIDA totalIndiaIndonesiaIran, Islamic Rep.IraqIrelandIsraelItalyJamaicaJapanJordanKazakhstanKenyaKorea, Dem. People’s Rep.Korea, Rep.KuwaitKyrgyz RepublicLao PDRLate-demographic dividendLatin America & Caribbean Latin America & Caribbean (excluding high income)Latin America & the Caribbean (IDA & IBRD countries)LatviaLeast developed countries: UN classificationLebanonLiberiaLibyaLithuaniaLow & middle incomeLow incomeLower middle incomeMacao SAR, ChinaMacedonia, FYRMadagascarMalawiMalaysiaMaliMauritaniaMexicoMiddle East & North AfricaMiddle East & North Africa (excluding high income)Middle East & North Africa (IDA & IBRD countries)Middle incomeMoldovaMongoliaMoroccoMozambiqueMyanmarNamibiaNepalNetherlandsNew ZealandNicaraguaNigerNigeriaNorth AmericaNorwayOECD membersOmanPakistanPanamaPapua New GuineaParaguayPeruPhilippinesPolandPortugalPost-demographic dividendPre-demographic dividendPuerto RicoQatarRomaniaRussian FederationRwandaSaudi ArabiaSenegalSerbiaSierra LeoneSingaporeSlovak RepublicSomaliaSouth AfricaSouth AsiaSouth Asia (IDA & IBRD)South SudanSpainSri LankaSub-Saharan Africa Sub-Saharan Africa (excluding high income)Sub-Saharan Africa (IDA & IBRD countries)SudanSwedenSwitzerlandSyrian Arab RepublicTajikistanTanzaniaThailandTogoTunisiaTurkeyTurkmenistanUgandaUkraineUnited Arab EmiratesUnited KingdomUnited StatesUpper middle incomeUruguayUzbekistanVenezuela, RBVietnamWest Bank and GazaWorldYemen, Rep.ZambiaZimbabwe Linea del tempo:
Questa scala temporale mostra un grafico dal 1961 anno al 2016 anno. Central Europe and the Baltics. I dati fino ad 1960 anno non disponibili. Il numero di osservazioni attuali secondo i date: 56.
La fonte (nome):
Indicatori dello sviluppo mondiale
La fonte (organizzazione):
United Nations, World Urbanization Prospects.
Categorie:
Urban Development
sono stati aggiornati
23 apr 2017 anni
Indicatori delle variazioni dei valori per anni
Minima:
16.008
1 gen 2000 anni
Massimo:
18.524
1 gen 1961 anni
Alla data di osservazione
Valore
Variazione assoluta
La variazione rispetto al valore precedente
1 gen 1961 anni
18.524
+18.524
0.0%
1 gen 1962 anni
18.409
-0.115
-0.62%
1 gen 1963 anni
18.305
-0.104
-0.56%
1 gen 1964 anni
18.196
-0.11
-0.6%
1 gen 1965 anni
18.082
-0.113
-0.62%
1 gen 1966 anni
18.006
-0.076
-0.42%
1 gen 1967 anni
17.961
-0.045
-0.25%
1 gen 1968 anni
17.924
-0.037
-0.21%
1 gen 1969 anni
17.9
-0.024
-0.13%
1 gen 1970 anni
17.9
+0.0
0.0%
1 gen 1971 anni
17.942
+0.042
0.23%
1 gen 1972 anni
17.966
+0.024
0.14%
1 gen 1973 anni
17.926
-0.041
-0.23%
1 gen 1974 anni
17.885
-0.04
-0.23%
1 gen 1975 anni
17.839
-0.046
-0.26%
1 gen 1976 anni
17.789
-0.051
-0.28%
1 gen 1977 anni
17.752
-0.037
-0.21%
1 gen 1978 anni
17.684
-0.068
-0.39%
1 gen 1979 anni
17.584
-0.1
-0.56%
1 gen 1980 anni
17.487
-0.097
-0.55%
1 gen 1981 anni
17.366
-0.121
-0.69%
1 gen 1982 anni
17.263
-0.103
-0.59%
1 gen 1983 anni
17.173
-0.089
-0.52%
1 gen 1984 anni
17.092
-0.082
-0.48%
1 gen 1985 anni
17.017
-0.075
-0.44%
1 gen 1986 anni
16.948
-0.069
-0.4%
1 gen 1987 anni
16.872
-0.076
-0.45%
1 gen 1988 anni
16.786
-0.085
-0.51%
1 gen 1989 anni
16.709
-0.077
-0.46%
1 gen 1990 anni
16.674
-0.035
-0.21%
1 gen 1991 anni
16.64
-0.035
-0.21%
1 gen 1992 anni
16.632
-0.008
-0.05%
1 gen 1993 anni
16.576
-0.055
-0.33%
1 gen 1994 anni
16.463
-0.114
-0.69%
1 gen 1995 anni
16.369
-0.093
-0.57%
1 gen 1996 anni
16.278
-0.092
-0.56%
1 gen 1997 anni
16.224
-0.053
-0.33%
1 gen 1998 anni
16.137
-0.088
-0.54%
1 gen 1999 anni
16.08
-0.057
-0.35%
1 gen 2000 anni
16.008
-0.072
-0.45%
1 gen 2001 anni
16.022
+0.014
0.09%
1 gen 2002 anni
16.038
+0.016
0.1%
1 gen 2003 anni
16.12
+0.082
0.51%
1 gen 2004 anni
16.164
+0.044
0.27%
1 gen 2005 anni
16.2
+0.035
0.22%
1 gen 2006 anni
16.233
+0.034
0.21%
1 gen 2007 anni
16.258
+0.024
0.15%
1 gen 2008 anni
16.312
+0.055
0.34%
1 gen 2009 anni
16.344
+0.032
0.2%
1 gen 2010 anni
16.357
+0.013
0.08%
1 gen 2011 anni
16.402
+0.045
0.27%
1 gen 2012 anni
16.445
+0.043
0.26%
1 gen 2013 anni
16.468
+0.022
0.13%
1 gen 2014 anni
16.484
+0.016
0.1%
1 gen 2015 anni
16.495
+0.012
0.07%
1 gen 2016 anni
16.498
+0.003
0.02%
Classificazione dei paesi secondo i statistiche attuali per anni


Commenti: